Figures & data
Table 1. Characterization of REP-NLCs-Small, REP-NLCs-Large, and corresponding blank NLCs (mean ± SD, n = 3).
Figure 1. Characterization of NLCs. The particle sizes and PDI changes of REP-NLCs-Small and REP-NLCs-Large in pH 1.2 hydrochloric acid solution (A), pH 6.8 phosphate buffer (B), pH 7.4 phosphate buffer (C), SGF (D), SIF (E), FBS for 24 h (F), and at 4 °C for 7 days (G), respectively (mean ± SD, n = 3). The TEM images of REP-NLCs-Small (H) and REP-NLCs-Large (I), respectively. The in vitro release profiles of REP-NLC-Small, REP-NLC-Large and REP-Sol (J, mean ± SD, n = 3).
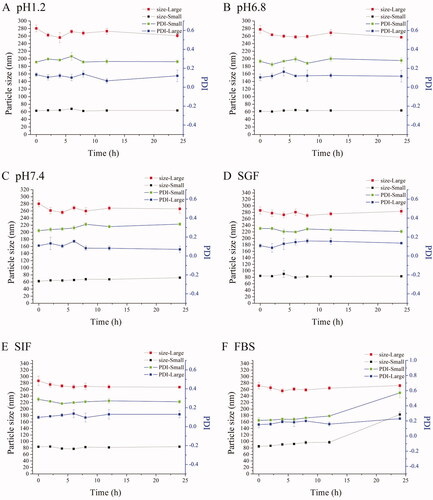
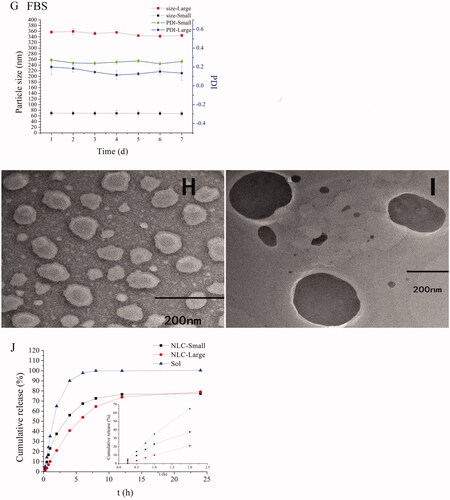
Figure 2. The mean plasma concentration–time curves of REP-NLCs-Small, REP-NLCs-Large, and REP-marketed tablets by orally administrated 1.28 mg/kg of repaglinide in rats (mean ± SD, n = 4).
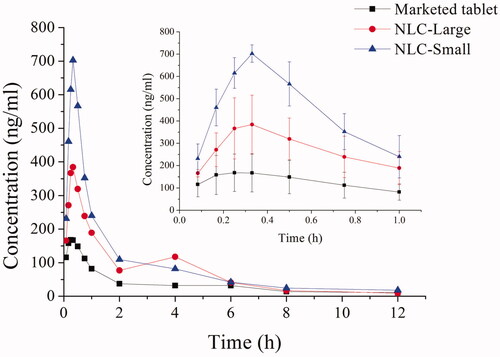
Table 2. Pharmacokinetic parameters in each group.
Figure 3. The Ka (A) and Peff (B) obtained from in situ single-pass intestinal perfusion of REP-NLCs-Small, REP-NLCs-Large, and REP-Sol in duodenum, jejunum, ileum, and colon in rats (means ± SD, n = 3, *p<.05, **p<.01).
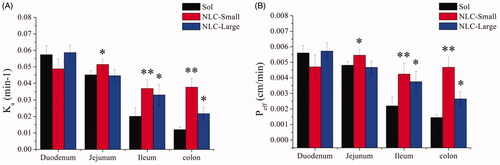
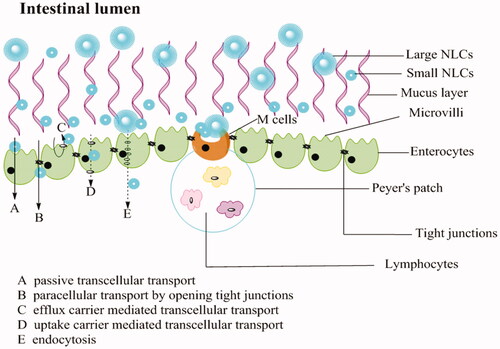
Figure 4. Schematic presentation of the mucus layer, intestinal epithelial cells layer and the transport routes of NLCs with different particles size.