Figures & data
Figure 1. Schematic illustration of different antitumor mechanisms of HA-ss-TOS-PTX against 4T1 cells and B16F10 cell bearing mice, respectively. After being intravenously administrated, HA-ss-TOS micelles rapidly accumulated in 4T1 tumor tissue and B16F10 melanoma cells.
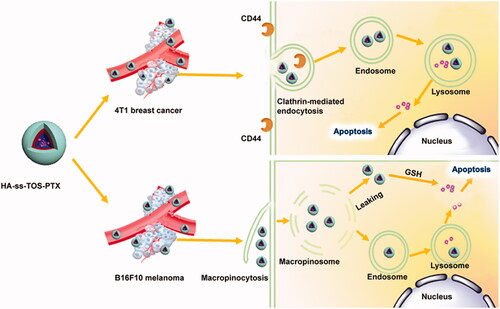
Figure 2. (A) TEM image of the HA-ss-TOS-PTX micelles. (B) TEM image of the HA-TOS-PTX micelles. (C) DSC curves of PTX, HA-ss-TOS, the physical mixture of PTX and HA-ss-TOS, and HA-ss-TOS-PTX. (D) WARD of PTX, the physical mixture of PTX and HA-ss-TOS, HA-ss-TOS-PTX, the physical mixture of PTX and HA -TOS, HA-TOS-PTX. (E) Fluorescence intensity of pyrene in the presence of different concentrations of GSH: (a) HA-ss-TOS without GSH; (b) HA-ss-TOS with 10 mM GSH; (c) HA-ss-TOS with 20 mM GSH; and (d) HA-TOS with 20 mM GSH.
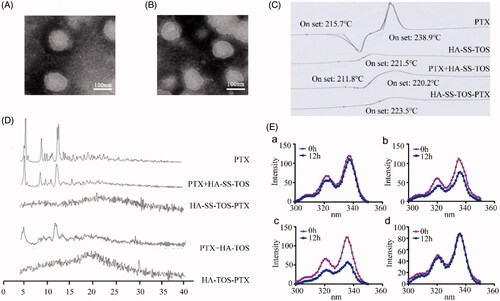
Figure 3. (A) CLSM images of A549, B16F10 and 4T1 cells after 1 h and 4 h in incubation with HA-ss-TOS-C6 micelles. Scale bars are 10 μm. (B) Intracellular uptake of HA-ss-TOS-C6 micelles, free-HA polymer pretreated HA-ss-TOS-C6 micelles and HA-TOS-C6 micelles at 1 h upon incubation with B16F10, A549 and 4T1 cells. (C) Intracellular uptake of HA-ss-TOS-PTX micelles, HA-TOS-PTX micelles and Taxol at 4 h upon incubation with B16F10, A549 and 4T1 cells. *p < .05, **p < .01, ***p < .001.
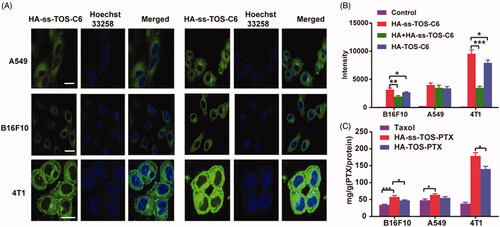
Figure 4. Relative internalization efficiency of HA-ss-TOS-C6 micelles by B16F10, A549 and 4T1cells in the presence of various endocytosis inhibitors. *p < .05 vs. control and **p < .01 vs. control.
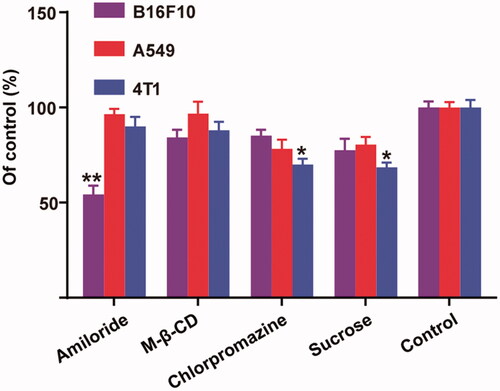
Figure 5. (A) Co-localization of the micelles into macropinosomes of 4T1 and B16F10 cells at 30 min as observed by CLSM. The macropinosomes were stained with Dextran-rhodamine. Scale bars are 20 μm. (B) Co-localization of the micelles into endo/lysosomes of 4T1 and B16F10 cells at 30 min as observed by CLSM. The endo/lysosomes were stained with Lyso-tracker red. Scale bars are 20 μm.
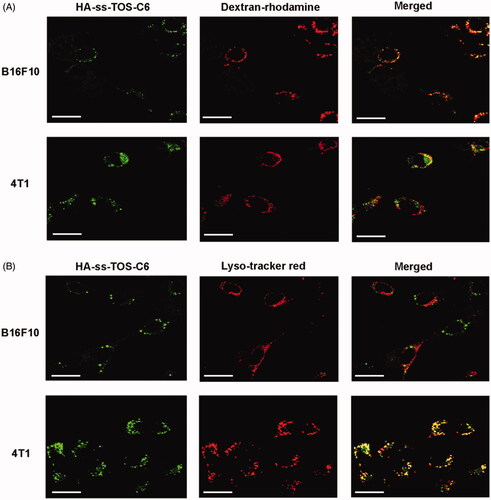
Figure 6. Anti-proliferative activity of (A) A549 cells, (B) B16F10 cells, and (C) 4T1 cells for (a) 24 h and (b) 48 h. IC50 values calculated from the cytotoxicity of Taxol, HA-TOS-PTX and HA-ss-TOS-PTX micelles against A549, B16F10 and 4T1cells after (D) 24 h and (E) 48 h. (F) Apoptosis of B16F10, A549 and 4T1 cells observed by CLSM after treatment with Taxol, HA-TOS-PTX and HA-ss-TOS-PTX at a PTX concentration of 1 μg/mL for 24 h. *p < .05, **p < .01, ***p < .001.
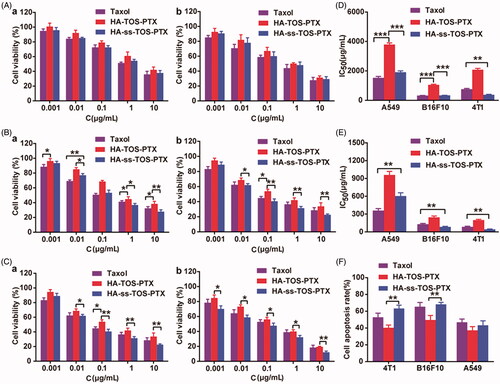
Figure 7. (A) In vivo imaging of DiR-loaded formulations in 4T1 tumor-bearing mice. Tumor sites were marked by pink circles. (B) Ex vivo imaging of the isolated organs in mice. (C) The change of PTX concentration over a period of time (n = 5).
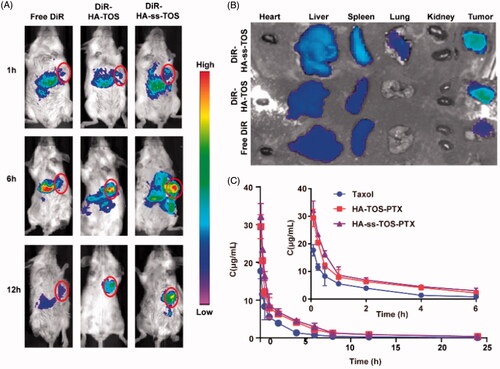
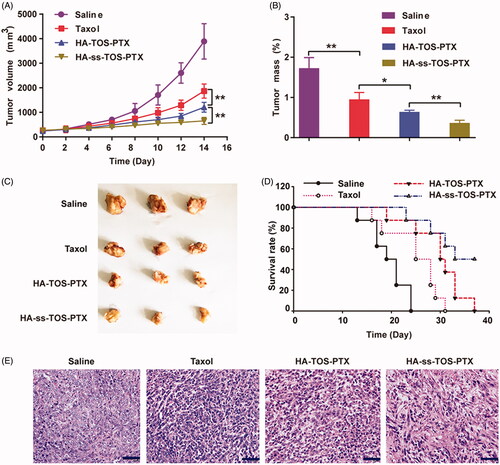
Figure 8. (A) The growth of tumors after being treated with saline, Taxol, HA-TOS-PTX and HA-ss-TOS-PTX (n = 11). (B) The weight of isolated tumor tissues from mice treated with saline, Taxol, HA-TOS-PTX, and HA-ss-TOS-PTX after 2 weeks (n = 3). (C) Images of isolated tumor tissues from mice treated with saline, Taxol, HA-TOS-PTX, and HA-ss-TOS-PTX after two weeks. (D) The survival rate of mice treated with saline, Taxol, HA-TOS-PTX, and HA-ss-TOS-PTX (n = 8). (E) The HE staining of isolated tumor tissues treated with saline, Taxol, HA-TOS-PTX and HA-ss-TOS-PTX after 2 weeks. Scale bars are 100 μm. *p < .05, **p < .01.