
Figures & data
Table 1. Formulation of TBESD solid dispersions.
Table 2. The factors and levels of orthogonal test.
Figure 1. Solubility of the components of (A) TBESD after forming ASD with various polymers in distilled water at room temperature; Dissolution profiles of (B) amentoflavone, (C) robustaflavone, (D) 2″,3″-dihydro-3′,3‴-biapigenin, (E) 3′,3‴-binaringenin, and (F) delicaflavone from TBESD and solid dispersion formulations, respectively (mean ± SD, n = 3).
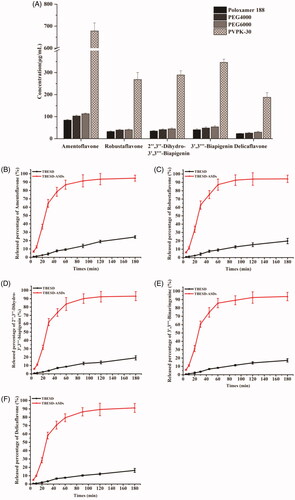
Table 3. Solubility from TBESD and ASDs with PVP K-30 in various pH medium at room temperature (mean ± SD, n = 3).
Table 4. Results of the orthogonal experiment (n = 3).
Figure 2. SEM images of (A) TBESD, (B) PVP K-30, and (C) TBESD-ASD; (D) DSC thermograms of TBESD, PVP K-30, PMs, and TBESD-ASD.
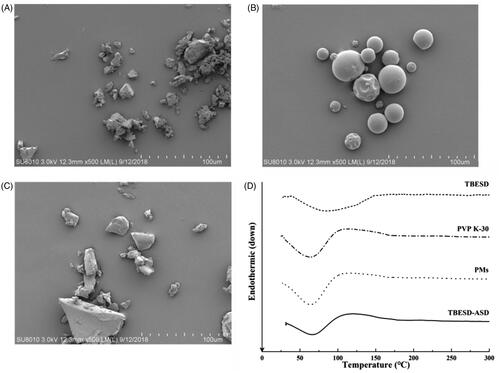
Figure 3. (A) PXRD patterns of TBESD, PVP K-30, PMs, and TBESD-ASD; (B) FT-IR spectra of TBESD, PVP K-30, PMs, and TBESD-ASD.
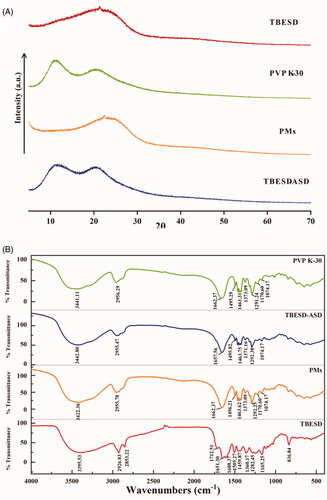
Figure 4. Chemical stability test of TBESD-ASD in difference exterior environment: (A) amentoflavone, (B) robustaflavone, (C) 2″,3″-dihydro-3′,3‴-biapigenin, (D) 3′,3‴-binaringenin, and (E) delicaflavone (mean ± SD, n = 3).
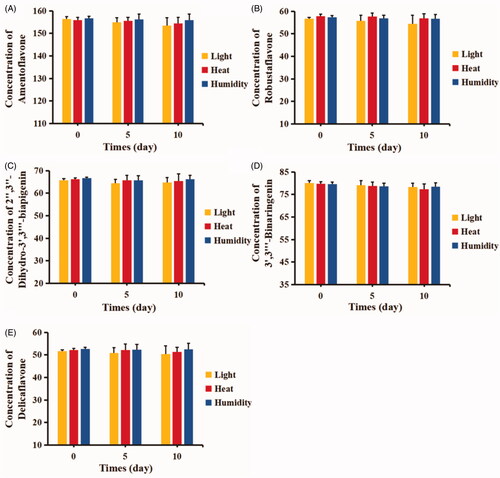
Figure 5. Mean concentration–time profiles of five active ingredients in rat plasma after a single oral administration of TBESD and solid dispersion formulations respectively (mean ± SD, n = 6).
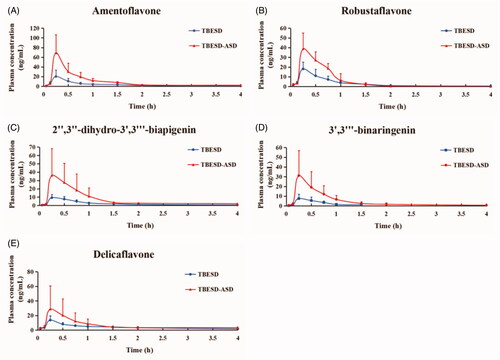
Table 5. Pharmacokinetic parameters of five active ingredients in rats following single oral administration of TBESD and solid dispersion formulations, respectively (mean ± SD, n = 6).
Figure 6. In vivo therapeutic study and Immunohistochemistry study of different TBESD formulations in a mice model. (A) Xenograft tumor in each group of mice after treatment, (B) xenograft tumor’s growth curve of mice (mean ± SD, n = 6), (C) the average weight change of mice (mean ± SD, n = 6), and (D) representative CD34 staining (×200) of xenograft tumor in each group.
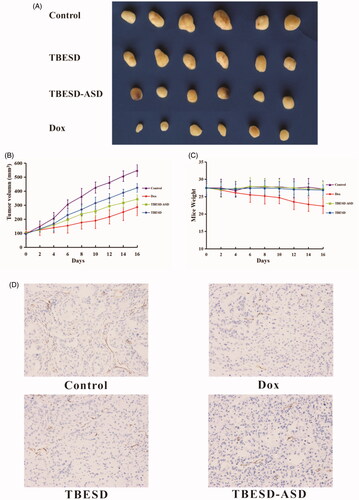
Table 6. The average weights and tumor weight-inhibitions of mice before and after treatment (mean ± SD, n = 6).