
Figures & data
Figure 1. (A) The flow of synthesizing carrier materials, the amphiphilic polymers PEG-PSA-BRZ; (B) 1H NMR spectrum of PEG-PSA-BRZ.
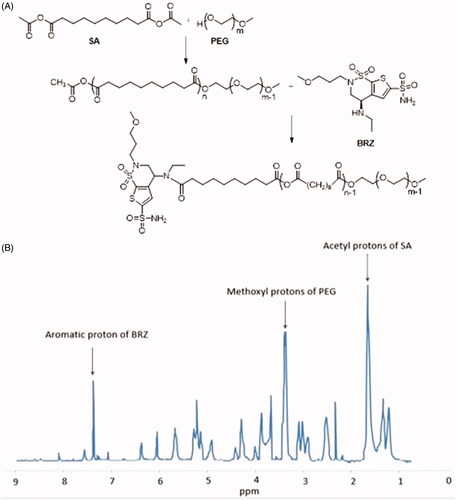
Figure 2. (A) TEM image of PEG-PSA nanoparticles; (B) Statistical particle size of PEG-PSA nanoparticles; (C) Zeta potential (mV) of PEG-PSA nanoparticles.
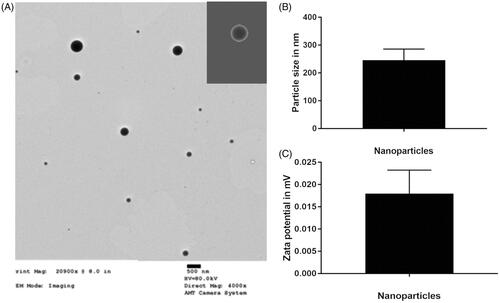
Figure 3. The Cumulative release of nanoparticles.
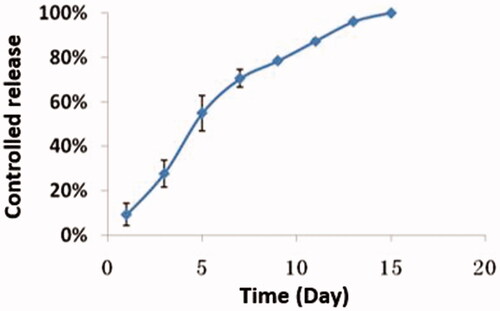
Figure 4. Fluorescent tracing image of the miRNA/NP-BRZ injected into the vitreous body at different time intervals. After 6 h of vitreous injection, the miRNA/NP-BRZ could pass through the vitreous body and reach the fundus of the eye and the GCL layer in the retina. After 24 h, some of the miRNA/NP-BRZ entered the INL layer and the ONL layer. After 48 h, nanoparticles could still be found in all layers of the retina. Scale bar: 40 μm.
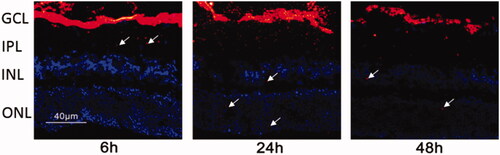
Figure 5. The status of IOP in mice with high IOP after injection of PBS and miRNA/NP-BRZ. There was a significant increase in IOP after the polystyrene microbeads injection (p < .01). On the sixth day, the IOP dropped to minimum in microbead + miRNA/NP-BRZ group. There was a significant reduction in IOP compared to the microbead + PBS group (p < .01) and microbead group (p < .01). Statistical significance was set at p < .05. PBS: phosphate-buffered saline.
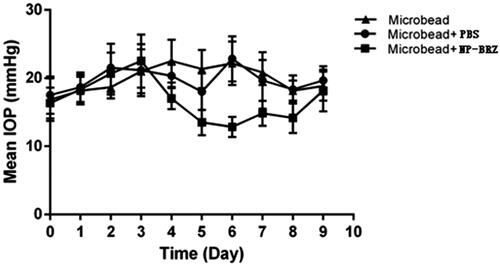
Figure 6. (A) Comparison of the survival rate between ONC and ONC + PBS and ONC + MPP; (B) The results of Tuj-1 immunofluorescence staining. After the miRNA/NP-BRZ treatment, the survival rate of Tuj-1+ cells in ONC + miRNA/NP-BRZ group was much higher than that in ONC group (**p < .01) and ONC + PBS group (**p < .01). There was no significant difference between ONC group and ONC + PBS group (p > .05). Scale bar: 40 μm. Statistical significance was set at p < .05. miRNA/NP-BRZ: drug-loaded nanoparticles; ONC: optic nerve crush; PBS: phosphate-buffered saline.
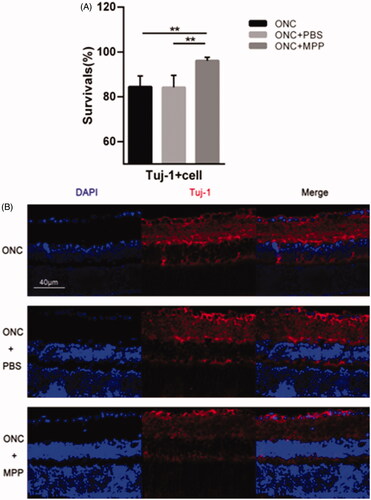
Figure 7. (A) Comparison of apoptosis rate in three groups; (B) fluorescent staining of retinal sections on day 3 following ONC using TUNEL assay. Only the light red stained cells in the GCL of retina were counted as TUNEL positive cells and the cellular nucleus were stained by light blue DAPI. The apoptotic rate of cells in the RGC layer was remarkably reduced in miRNA/NP-BRZ group compared to that of ONC group (**p < .01) and ONC + PBS group (**p < .01), which was significantly reduced by miRNA/NP-BRZ treatment.
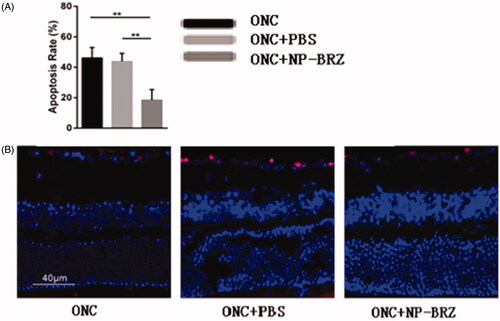
Figure 8. (A) Comparison of RGC numbers in three groups; (B) the results of the RGC density using the fluorogold labeling. The density of surviving RGCs in ONC + miRNA/NP-BRZ group was much higher than that in ONC group (**p < .01) and ONC + PBS group (**p < .01). There was no significant difference between ONC group and ONC + PBS group (p > .05). (C) The expression levels of RGC-selective genes were upregulated after miRNA/NP-BRZ injection. The retina mRNA expressions of Thy1.1 and Nefh were all significantly increased in ONC + miRNA/NP-BRZ group on day 3 after ONC when compared to ONC group and ONC + PBS group (**p < .01, *p < .05). miRNA/NP-BRZ treatment improved the mRNA expressions of Thy1.1 and Nefh in ONC + miRNA/NP-BRZ group when compared to ONC group and ONC + PBS group. Scale bar: 40 μm. Statistical significance was set at p < .05. miRNA/NP-BRZ: drug-loaded nanoparticles; ONC: optic nerve crush; PBS: phosphate-buffered saline.
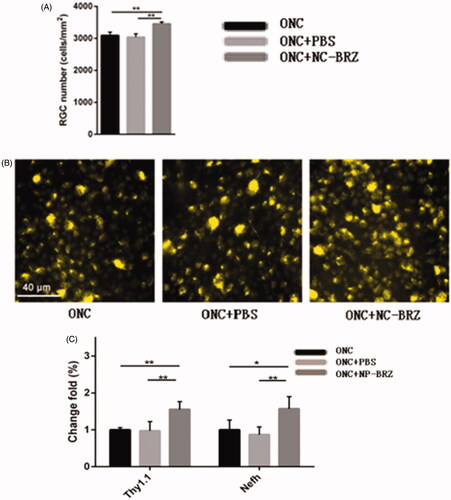
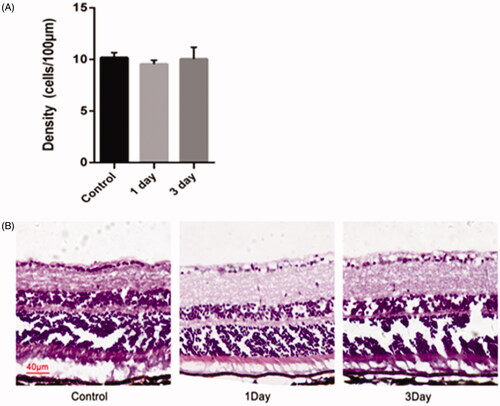
Figure 9. Morphological changes and cell density of RGCs in the retina of mice after an intravitreal injection of miRNA/NP-BRZ. There was no significant difference in the retina on day 1 and day 3 after miRNA/NP-BRZ injection compared to the normal retina. Abnormal changes in cell morphology was not observed in the 3 groups. Scale bar: 40 μm; Statistical significance was set at p < .05; miRNA/NP-BRZ, drug-loaded nanoparticles.
Data availability statement
Data available within the article or its supplementary materials.