Figures & data
Figure 1. Schematic diagram of an erythrocyte-mimicking combination nanosystem for high-dose chemotherapy. (A) In vivo distributions of the PNM system. The PNM is capable of delivering high-dose chemodrugs to tumor site due to high drug-loading amount of nanocrystals and high drug delivery efficiency of EM, which can disguise the nanocrystals in blood circulation system and escape from reticuloendothelial system (RES) to achieve long circulation EPR effect. (B) The components of PNM. The PNM consists of three compositions: PTX nanoparticle as solid core, PEG-PTX for hydrophilicity/hydrophobicity adjustment and biomimetic shell of erythrocyte membrane-derived vesicles.
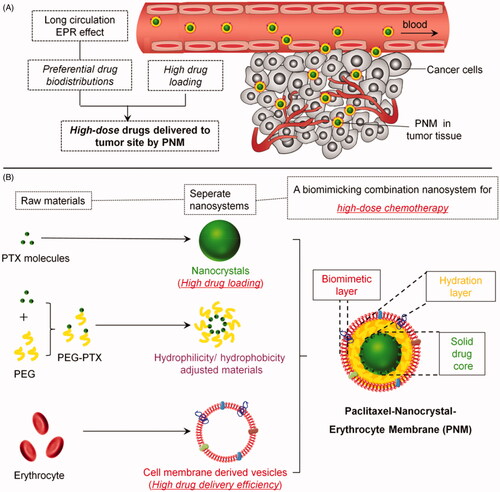
Figure 2. In vitro characterization of PN, PEGylated PN, and the PNM. (A) and (B) showed the morphology of nod-shaped PN and spherical-shaped PN by TEM, respectively; (C) and (D) represented particle size distribution of PEGylated PN and the PNM, respectively, measured by DLS and TEM; (E) Comparison of average particle size of PN, PEGylated PN, and the PNM; (F) Zeta potential of PN, PEGylated PN, and the PNM; (G) SDS-PAGE gel analysis of protein content in PN, PEGylated PN, and the PNM referred to RBC lysate; the error bars indicated ± SD (n = 3).
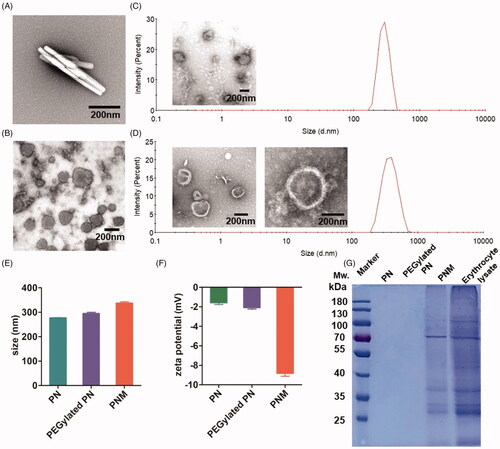
Figure 3. In vitro stability, drug loading and drug release properties of PN, PEGylated PN, and the PNM. (A) Digital photo of three nanoparticles storage at 4 °C taken at indicated time, visible sediments were pointed by yellow arrow; (B) Change of particle size of three nanoparticles in two months’ storage; (C) PTX loading rate of three nanoparticles determined by HPLC; (D) Drug leakage performance of formulations; (E) Cumulative percentage of drug release from various formulations; all the scale bars indicated ± SD (n = 3).
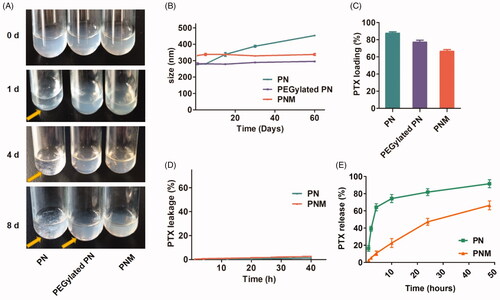
Figure 4. Cellular uptake of nanoparticles with fluorescence labeling. (A) Confirmation of DiR hybrid nanoparticles. All the nanoparticles were separated by centrifuge and filtration, the fluorescence intensity was detected by resolved precipitate in solvent, which showed almost all DiR successfully hybrid into nanoparticles with only a few free DiR left in suspension; (B) Comparison of cellular uptake of PDN and PDNM on various cell lines, visualized by DiR fluorescence imagining.
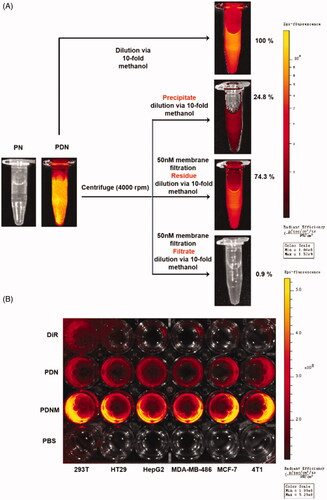
Figure 5. Cytotoxicity of formulations on cell lines. (A) Cytotoxicity of formulations on 4T1 murine breast cancer cell line for 48 h incubation, * p < 0.05 vs PN, ** p < 0.01 vs PN; (B) Cytotoxicity of formulations on 3T3 murine fibroblast cell line for 48 h incubation, **p < 0.01 vs Taxol, *** p < 0.001 vs Taxol; error indicated ± SD (n = 4).
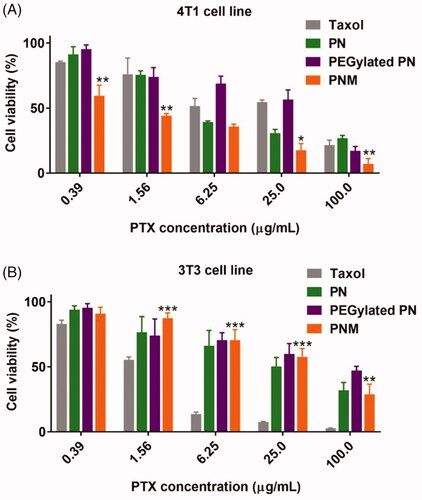
Figure 6. In vivo NIR fluorescence imaging of DiR-labeled PDN and PDNM. (A) In vivo imaging of 4T1 cancer-bearing BALB/c mice receiving a single injection of PDN or PDNM, respectively. The dashed black circles indicate the tumor burden. (B) Ex vivo imaging of tumor and organs excised from 4T1 tumor-bearing mice 24 h post injections of the two fluorescent formulations. Compared to PDN, the PDNM showed higher drug distributions at tumor site. The yellow arrows point to the tumor tissue.
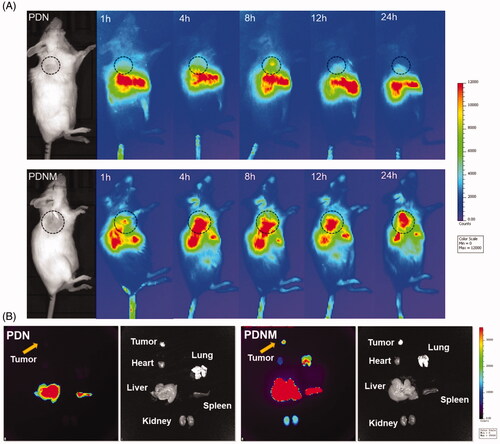
Figure 7. In vivo antitumor activity of different PTX formulations against 4T1-xenografted BALB/c mice. (A) Tumor growth curve of different mouse groups with administrations of saline, PN (PTX dose 10 mg/kg) and the PNM (PTX dose 10 mg/kg); (B) Weight of ex vivo tumors from the mice sacrificed by cervical dislocation at the experimental end point; (C) Body weight change of mice in different groups; (D) Image of excised tumors from different groups; (E) Representative organs of mice from control group and PNM treated group, metastatic nodules of lung tissue from control group directed by yellow arrow; error bars indicated ± SD (n = 5 for each group), *p < 0.05, **p < 0.01.
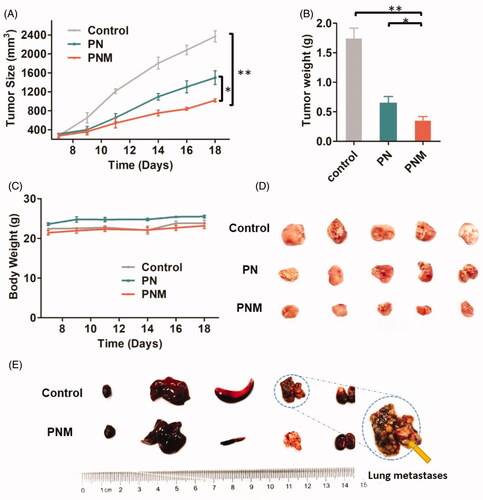
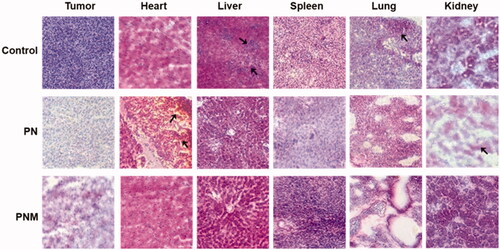
Figure 8. H&E staining of tissue sections (40×) from different treatment groups, black arrows pointed at obvious morphological changes. The lesions in liver and metastases in lung from control group were relieved once received PN and PNM treatment. Moreover, cardiac and renal toxicities of PTX were significantly alleviated in PNM treated group compared to PN.