Figures & data
Table 1. The physical characteristics of the NE formulations measured by the Zetasizer.
Figure 1. The percentage of A549 cell viabilities was determined by MTT assay after 24 h drug exposure with the desired concentrations of the tested formula. Error bars represent the standard deviation for n = 3.
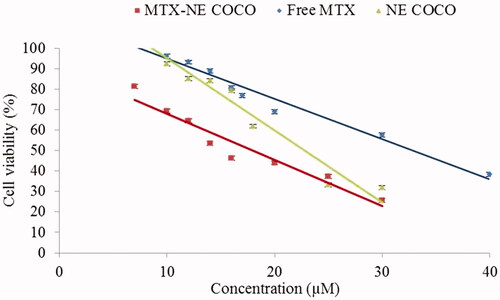
Figure 2. A graph represents the IC50 (µM) of the tested formulas when subjected to the A549 non-small cell lung cancer cells. The level of variations between the IC50 of free-MTX and the other NE formulas were expressed as highly (**.001<p < .01) and very highly (***p < .001) significant difference.
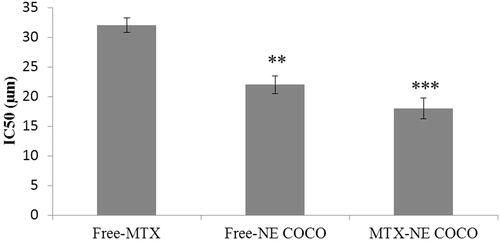
Figure 3. (A) Light microscopy images of A549 non-small cell lung cancer cells treated for 24 h at the IC50 of free MTX, free-NE COCO, and MTX-NE COCO. Signs of apoptosis are represented by the black arrows (chromatin condensation) and yellow arrows (intercellular space). Images were magnified at ×40. (B) Fluorescence microscopy images of DAPI stained A549 non-small cell lung cancer cells treated for 24 h at the IC50 of free MTX, free-NE COCO, and MTX-NE COCO. The red arrows point at the altered nuclei (chromatin condensation). Images were magnified at ×20.
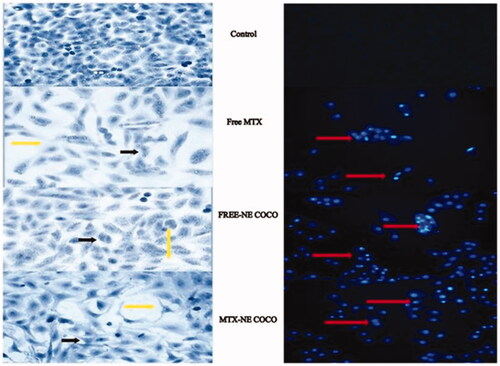
Figure 4. ROS values of brain tissue homogenates for the experimental groups. The superscripts (a, b, c) display the statistical significant variations between the desired group and C (–ve), C (+ve), and free MTX, respectively (p < .05).
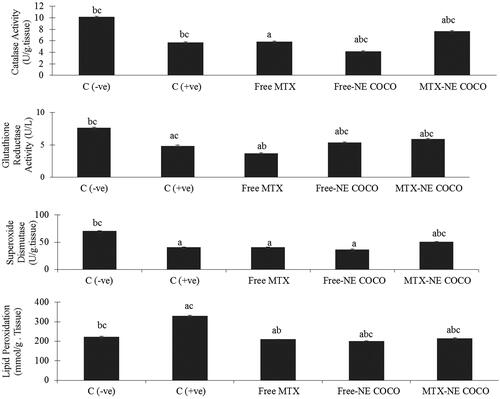
Figure 5. (I) Photomicrographs of the resected brain for the tested mice and their brain weight ratio (BWT). (II) Light microscopy images of the cerebellar cortex of (A) C (–ve) group showing molecular layer (M), granular layer (G), and Purkinje cells (P); (B) C (+ve) group exhibiting disorganized architecture of cerebellar cortex of brain; (C) free MTX group showing inflammation and hemorrhage (black arrows); (D) free-NE COCO group displaying small changes in the cerebellar cortex of brain; and (E) MTX-NE COCO group showing arranged structure of molecular layer, granular layer, and Purkinje cells. Images were magnified at ×40.
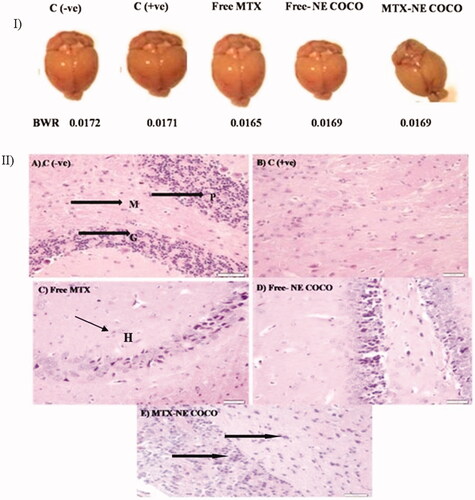
Figure 6. The (ROS) values in lung tissue homogenates of the groups. The superscripts (a, b, c) display the statistical significant variations between the desired group and C (–ve), C (+ve), and free MTX, respectively (p < .05).
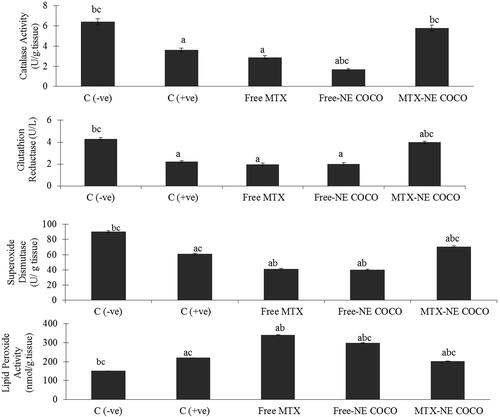
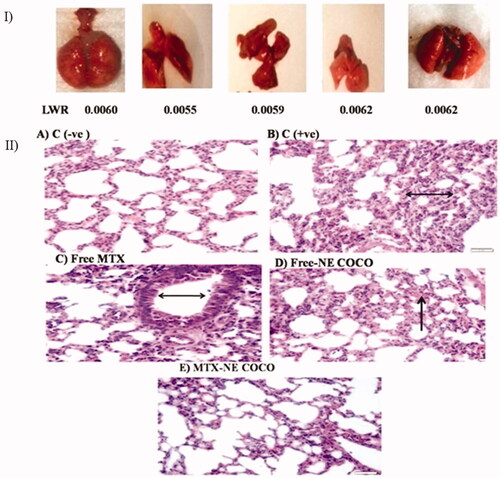
Figure 7. (I) photomicrographs of the resected lung for the tested mice and their lung weight ratio (LWR). (II) Light microscopy images of the lung tissues. (A) C (–ve) group represents the normal tissue of the lung’s mice. (B) C (+ve) group and (C) free MTX group display the abnormality thickness of the alveolar wall (black arrows). (D) The free-NE COCO group exhibits increased hemorrhage (black arrow). (E) MTX-NE COCO group showing the arranged structure of the alveolar wall. Images were magnified at ×40.