
Figures & data
Figure 1. (a) The apparent morphology of catanionic aggregation in solutions of SSS-CH. (b) The TEM photos of SSS-CH catanionic aggregates. X1 is expressed as the mass fraction of CH (X1=mCH/m(SSS+CH)).
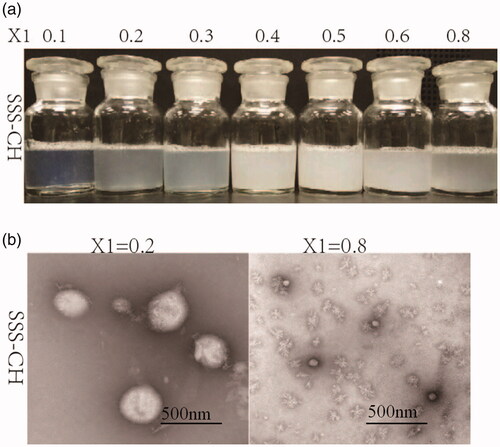
Figure 2. Particle size distribution diagram of SSS-CH catanionic aggregate solutions with different X1 values.
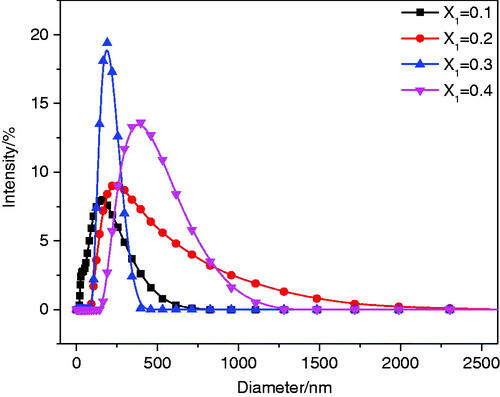
Figure 3. (a) Conductivity diagram of SSS-CH catanionic aggregate solutions with different X1 values. (b) Turbidity values for SSS-CH catanionic aggregate solutions with different X1 values.
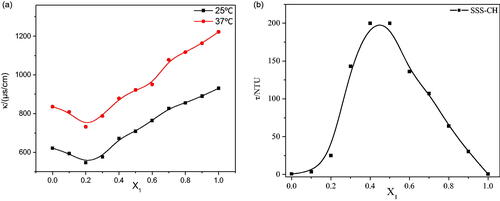
Table 1. The zeta potential value of SSS-CH catanionic aggregate solutions with different X1 values.
Figure 4. Drug release results for SSS-CH catanionic aggregate solutions with different X1 values (n = 3).
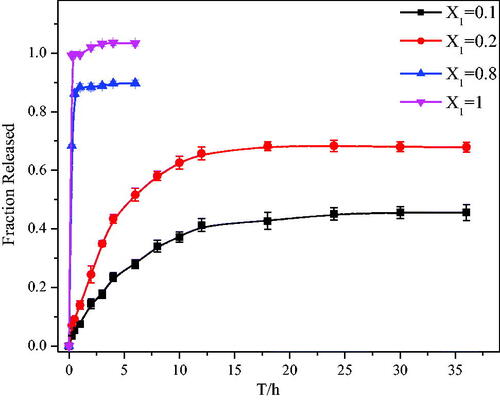
Figure 5. Cell viability in response to different concentrations of SSS incubated with CEM and Ramous cells (n = 3). (a, b) Represents the effect of SSS on the survival rate of CEM and Ramous cells, respectively.
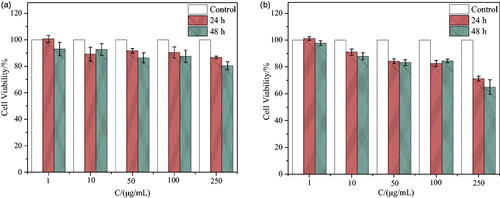
Figure 6. Cell morphologies of CEM (upper) and Ramous (lower) cells incubated with 100 µg/mL samples for 24 h and 48 h. Magnification: ×100.
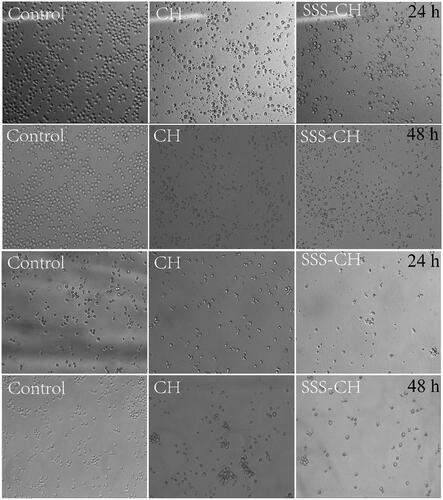
Figure 7. The inhibitory rates of different concentrations of CH and SSS-CH on CEM cells (n = 3), (a): 24 h, (b): 48 h, *Indicates the difference compared with the blank group, *p<.05, significant difference, **p<.01, very significant difference, ***p<.001, extremely significant difference.
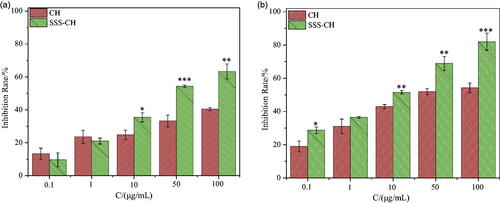
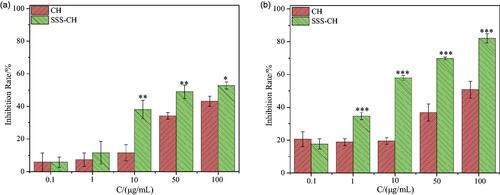
Figure 8. Inhibitory rates of different concentrations of CH and SSS-CH on Ramous cells (n = 3). (a): 24 h, (b): 48 h. *Indicates the difference compared with the blank group, *p<.05, significant difference, **p<.01, very significant difference, ***p<.001, extremely significant difference.
Data availability
The datasets used and/or analyzed during the current study as well as analysis scripts are available from the corresponding author on reasonable request.