Figures & data
Figure 1. The enhanced effect of LC-SA/CS-SA micelle on the oral absorption of PTX. (A) The preparation of PTX-loaded LC-SA/CS-SA micelles; (B) the OCTN2-mediated absorption mechanism of PTX encapsulated by LC-SA/CS-SA micelles.
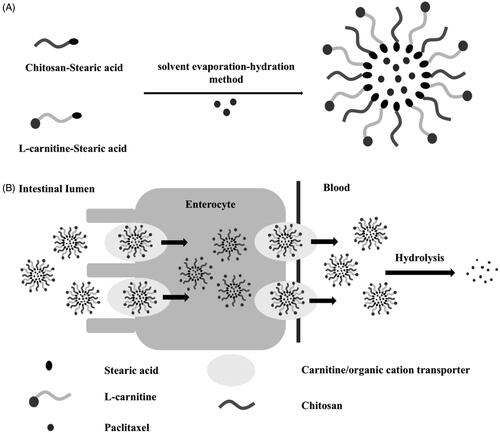
Figure 2. Synthetic route of CS-SA.
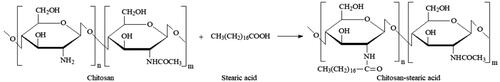
Figure 3. (A) 1H NMR spectra of CS (a), SA (b), CS-SA (c), and LC-SA (d); (B) FT-IR spectra of CS (a), SA (b), and CS-SA (c).
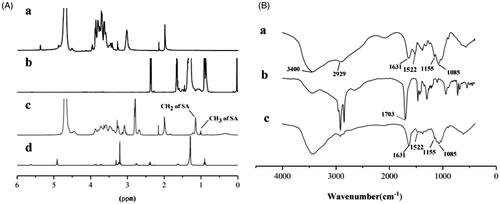
Figure 4. (A) Particle size distribution and TEM image of PTX-loaded LC-SA/CS-SA micelles; (B) the XRD curves of paclitaxel (a), PTX-loaded LC-SA/CS-SA micelles (b), PTX-free (blank) LC-SA/CS-SA (c), and physical mixture containing PTX and lyophilized blank LC-SA/CS-SA micelles (d).
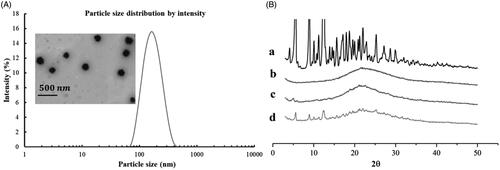
Figure 5. (A) The curve of the fluorescence intensity ratio (I373/I384) from pyrene vs. the logarithmic concentration of the material LC-SA/CS-SA; (B) the in vitro release profiles of Taxol (commercial formulation), PTX-loaded CS-SA micelles and PTX-loaded LC-SA/CS-SA micelles.
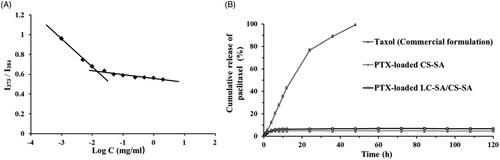
Figure 6. Oral pharmacokinetic profiles of TaxolTM (commercial formulation), PTX-loaded CS-SA micelles, PTX-loaded LC-SA/CS-SA micelles plus LC, and PTX-loaded LC-SA/CS-SA micelles in rats as per the PTX-equivalent dose of 30 mg/kg. The data are expressed as means ± S.D. (n = 5).
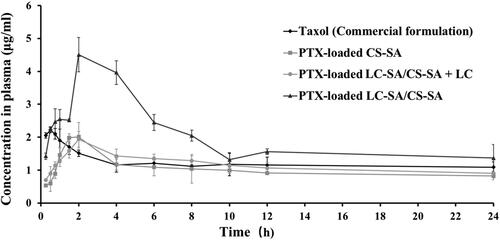
Table 1. Oral pharmacokinetic parameters of TaxolTM (commercial formulation), PTX-loaded CS-SA micelles, PTX-loaded LC-SA/CS-SA micelles plus LC, and PTX-loaded LC-SA/CS-SA micelles in rats.
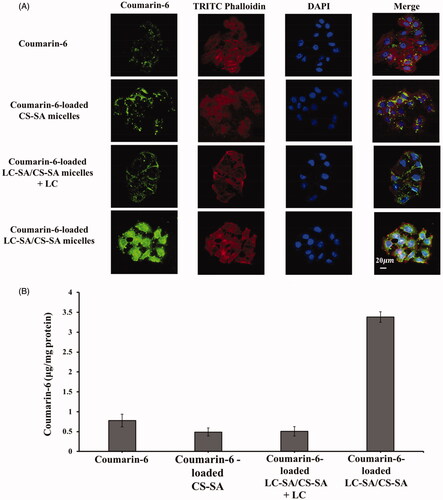
Figure 7. (A) Intracellular trafficking of coumarin-6, coumarin-6-loaded CS-SA micelles, coumarin-6-loaded LC-SA/CS-SA micelles plus LC, and LC-SA/CS-SA micelles after incubation for 1.5 h at 37 °C in Caco-2 cells. The cytoplasm (F-actins) was stained with TRITC-Phalloidin (red) and the nucleus with DAPI (blue), and the green fluorescence came from coumarin-6; (B) the quantitative uptake histogram of coumarin-6, coumarin-6-loaded CS-SA micelles, coumarin-6-loaded LC-SA/CS-SA micelles plus LC, and LC-SA/CS-SA micelles in Caco-2 cells. Data are shown as mean ± S.D. (n = 3, p< .05).