Figures & data
Table 1. Formula for the preparation of different NANOGEF formulations.
Figure 1. TEM, size and zeta potential of SNG (a) (size = 102.6 d.nm, ZP = −57.3 mV); TNG (b) (size = 127 d.nm, ZP = −28.9 mV); STNG (c) (size = 92.72 d.nm, ZP = −40.2 mV); TSNG (d) (size = 82.52 d.nm, ZP = −40.6 mV). (n = 1).
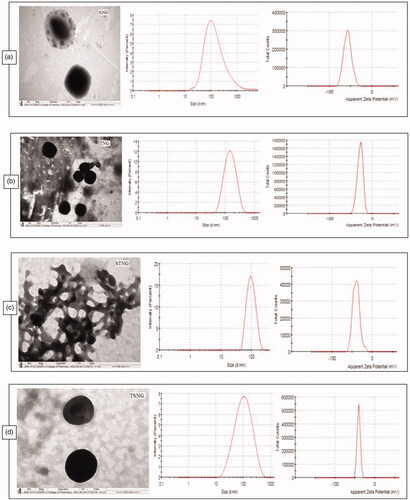
Table 2. Results of characterization (size, polydispersity index – PdI, zeta potential, entrapment efficiency – EE) of NANOGEFs.
Figure 2. Release pattern of NANOGEF formulations. TNG and SNG exhibited lesser amount of GEF release than TSNG and STNG (p < .05).
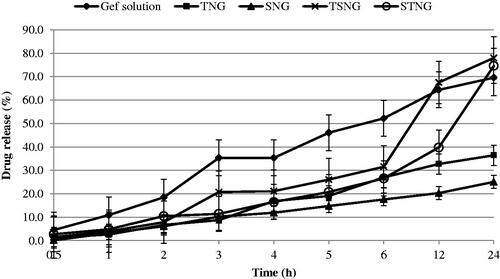
Table 3. Correlation coefficients (R2) value for GEF release from different NANOGEFs.
Figure 3. Effect of storage temperature on particle size of NANOGEFs. Storage temperature decreased particle size (p > .05) in case of SNG and TNG (may be because of complete covering of surface by surfactant leads to decrease in size during storage period). STNG (p > .05) and TSNG (p < .05) exhibited increase in particle size.
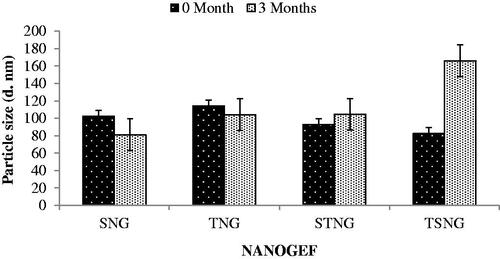
Figure 4. Effect of storage temperature on polydispersity index (PdI). SNG (p < .05) and STNG (p > .05) exhibited lowering in PdI. TNG and TSNG exhibited increase in PdI (p > .05).
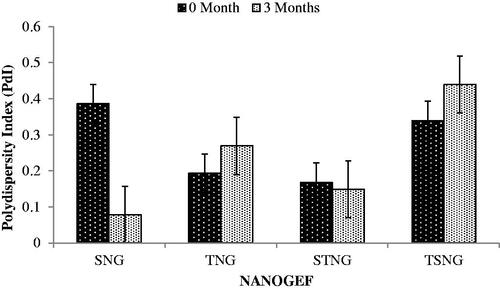
Figure 5. Effect of storage temperature on entrapment efficiency (% EE). All NANOGEFs were estimated to show decrease in EE (p > .05).
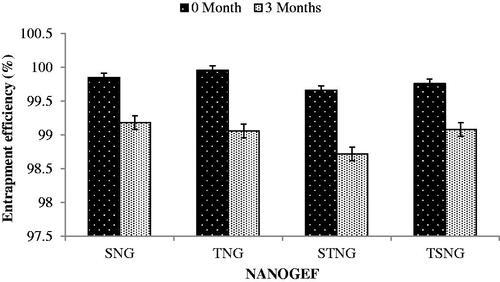
Figure 6. Effect of storage temperature on zeta potential. All NANOGEFs were found to exhibit decrease in ZP (p > .05).
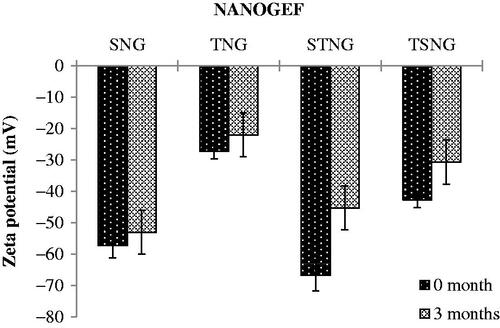
Figure 7. Inhibition effect of GEF alone and NANOGEF (TSNG) (p < .05) on HCT 116 cells. Results are presented with means ± SD for n = 3.
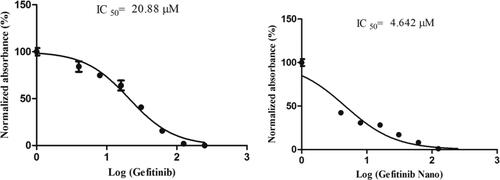
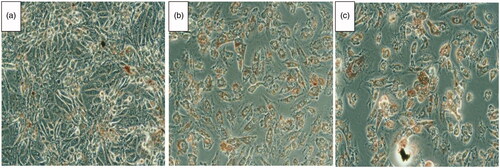
Figure 8. HCT 116 cells treated with IC50 concentration of GEF (B), TSNG (C) and Control (A). The red color inside the cells indicates the infiltrated neutral red in dead cells.