Figures & data
Figure 1. Permeation profiles of FP in patches with or without enhancers through rabbit skin (n = 4, mean ± SD), the amount of 4-O-acylterpineol is equal to the molar concentration of 4-TER.
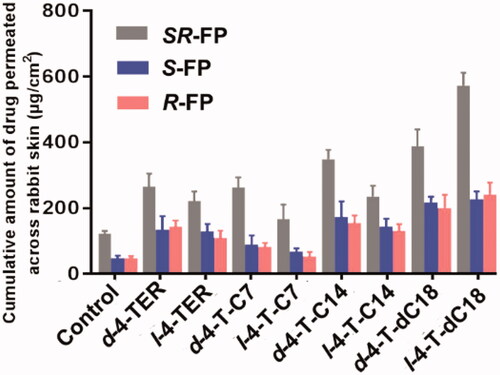
Table 1. Skin permeation parameters of the SR-FP and its enantiomers through excised rabbit skin from the patches containing 5% drugs (w/w).
Figure 2. (A) Plasma concentration-time profiles of FP after intravenous injection in the rabbits; (B)–(F) Plasma concentration-time profiles in rabbits after transdermal application patches loaded FP racemate or enantiomer with or without enhancers; (B) control loaded FP racemate; (C) d-4-TER loaded FP racemate; (D) d-4-T-dC18 loaded FP racemate; (E) l-4-T- dC18 loaded FP racemate; (F) d-4-TER loaded enantiomers of FP (the dotted line represents the blood concentration after removing the patch) (n = 6, mean ± SE).
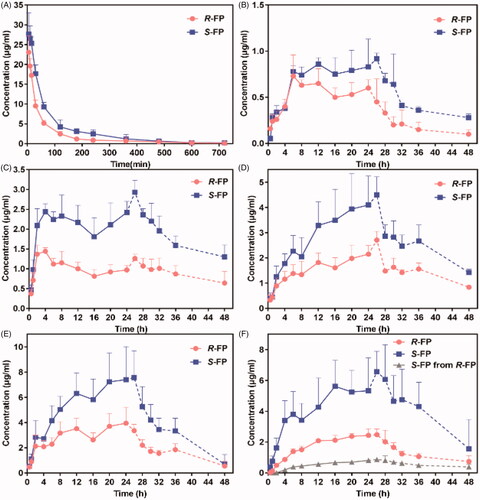
Figure 3. Interaction of the CER-NP assemblies with molecular models of drugs and enhancers. Carbon atoms were colored gray, oxygen atoms red, nitrogen atoms blue, hydrogen atoms white, fluorine atoms cyan. These figures are screenshots of the CER-NP assemblies. H-bonds were presented in light blue dotted lines.
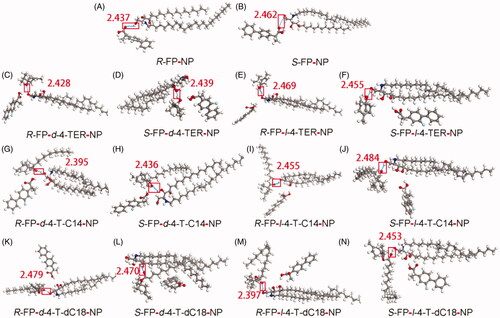
Table 2. Pharmacokinetic parameters of FP enantiomers in rabbits after application of transdermal patches loaded SR-FP with or without enhancers.
Figure 4. ATR-FITR spectra of the rabbit SC after treatment with or without enhancers (n = 3). The OH symmetric vibration of SC lipids is around 3271 cm–1, the initial frequencies of vsCH2 and vasCH2 are around 2848 cm–1 and 2916 cm–1, respectively. The amide I and amide II are around 1640 cm–1 and 1543 cm–1, respectively.
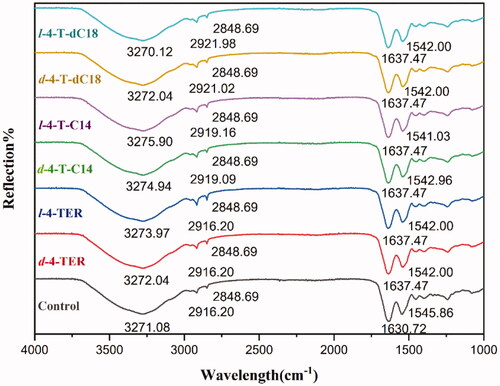
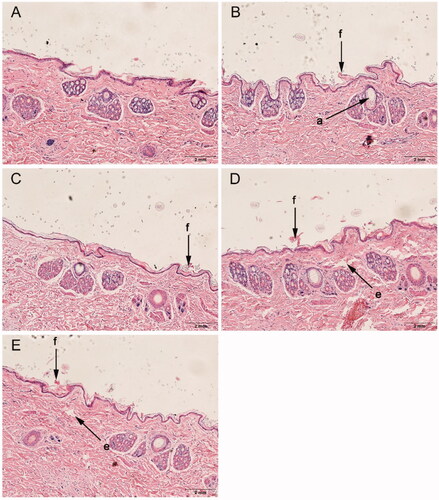
Figure 5. Histological sections of rabbit skin after treatment with or without enhancers. (A): control, (B): d-4-TER, (C): l-4-TER, (D): d-4-T-dC18 and (E): l-4-T-dC18. All tissue sections are magnified 100× (H&E). a, appendageal dilatation; e, edema; and f, focal disruption of epidermis, hyperkeratosis.