
Figures & data
Figure 1. Characterization of Res-DPPC-LNs. (A) the appearance of Res-DPPC-LNs suspensions, (B) transmission electron microscopic image, (C) size distribution, (D) zeta potential, (E) In vitro release profiles of plain Res and Res-DPPC-LNs suspensions in pH 7.4 PBS at 37 °C (Data represent mean ± SD, n = 6). () plain Res, () Res-DPPC-LNs.
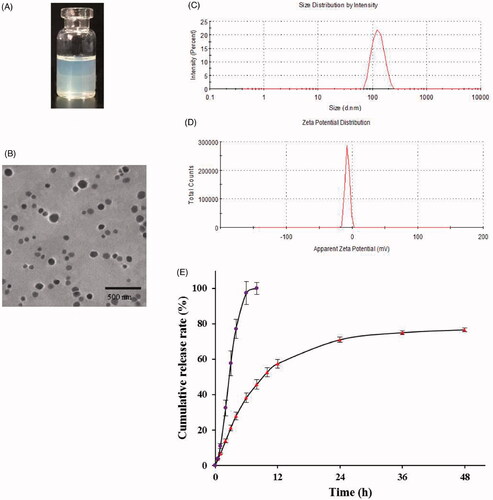
Table 1. Results of model fitting of release curves of Res-DPPC-LNs in PBS.
Figure 2. Physicochemical stability of Res-DPPC-LNs: (A) entrapment efficiency, (B) PDI, (C) size and (D) zeta potential. Data represent mean ± SD, n = 3.
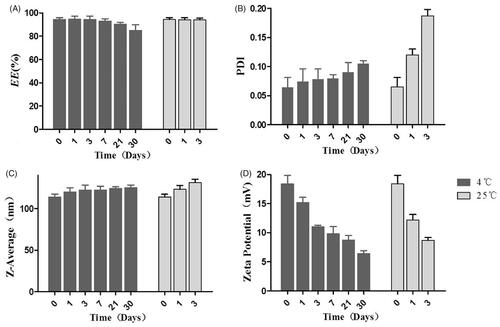
Figure 3. (A) Viability of rat PASMCs upon incubation with formulations or individual components of formulation. (mean ± SD, n = 6), (B) Representative fluorescence microscopic images showing the uptake of Free Rh123 and Rh123-DPPC-LNs by pulmonary arterial smooth muscle cells. Blue color represents cell nucleus stained with DAPI. Red color represents Rh123, (C) Effect of Plain Res and Res-DPPC-LNs on 5-HT induced PASMC proliferation (mean ± SD, n = 6). *** P < 0.001.
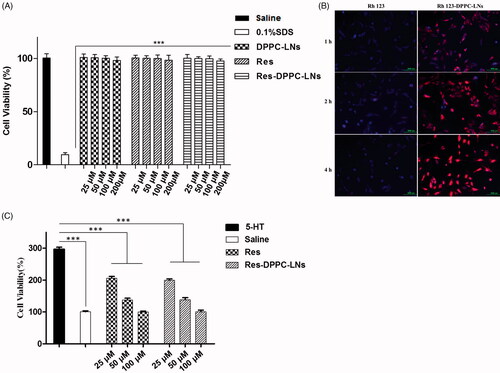
Figure 4. (A) In vivo absorption profile of Res following intratracheal inhalation of the Res-DPPC-LNs and intravenous administration of the Res solution to rats. (dose = 10 mg/kg, mean ± SD, n = 6), (B) The Res lung concentration-time profiles following intratracheal inhalation of the Res-DPPC-LNs and intravenous administration of the Res solution to rats. (dose = 10 mg/kg, mean ± SD, n = 6).
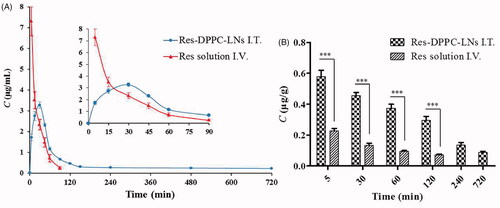
Table 2. The plasma pharmacokinetic parameters of Res following intratracheal inhalation of the Res-DPPC-LNs and intravenous administration of the Res solution to rats.