Figures & data
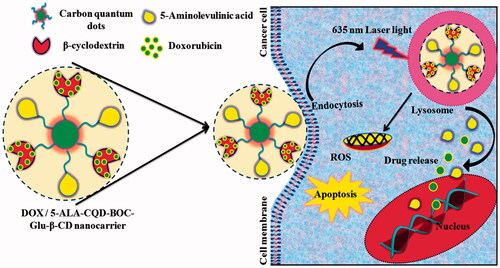
Figure 1. Overall representation for the preparation of 5-ALA-CQD-Glu-β-CD nanocarrier.
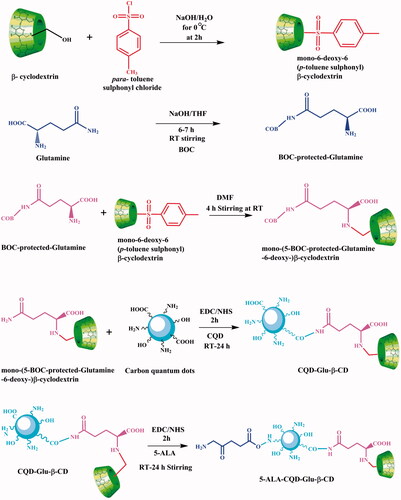
Figure 2. FTIR spectra of (a) Ts-β-CD, (b) BOC-Glu, (c) Ts-β-CD-g-BOC-Glu, (d) CQD, (e) CQD-Glu-β-CD, (f) 5-ALA-CQD-Glu-β-CD, and (g) DOX/5-ALA-CQD-Glu-β-CD nanocarrier.
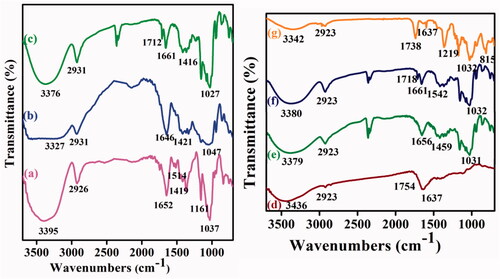
Figure 3. XRD pattern of (a) Ts-β-CD, (b) BOC-Glu, (c) Ts-β-CD-g-BOC-Glu, (d) CQD (e) CQD-Glu-β-CD, (f) 5-ALA-CQD-Glu-β-CD, and (f) DOX/5-ALA-CQD-Glu-β-CD nanocarrier.
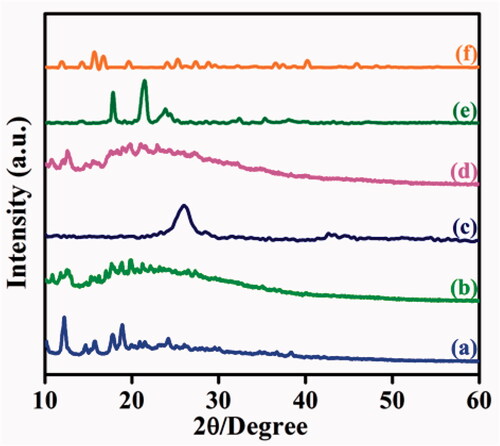
Figure 4. TEM images with SEAD spectrum of (a) CQD, (b) 5-ALA-CQD-BOC-Glu-β-CD, and (c) DOX/5-ALA-CQD-BOC-Glu-β-CD nanocarrier.
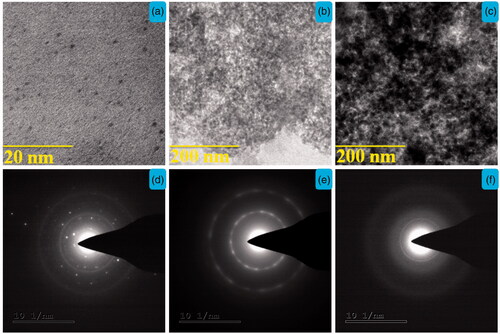
Figure 5. The AFM images of 2D, 3D, and topographical images of (a–c) CQD, (d–f) 5-ALA-CQD-BOC-Glu-β-CD, and (g–i) DOX/5-ALA-CQD-BOC-Glu-β-CD nanocarrier.
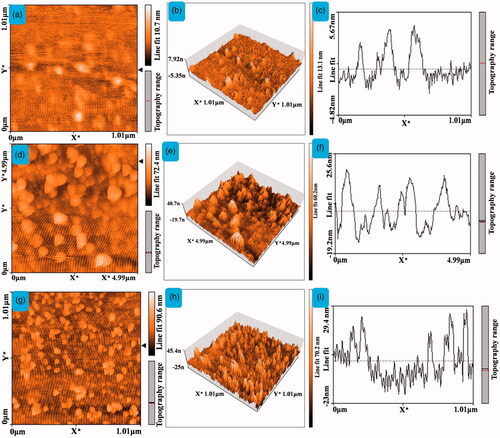
Figure 6. UV–vis spectrum (a) encapsulation efficiency and (b) loading capacity of DOX/5-ALA-CQD-BOC-Glu-β-CD nanocarrier.
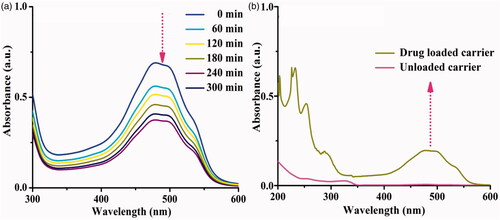
Figure 7. In vitro drug release behavior of 5-ALA and DOX drug from DOX/5-ALA-CQD-BOC-Glu-β-CD under three different physiological pHs (A) 2.8, (B) 5.5, (C) 6.8 at 27 °C for 24 h (A–C). Cumulative drug release (%) behavior (D–F).
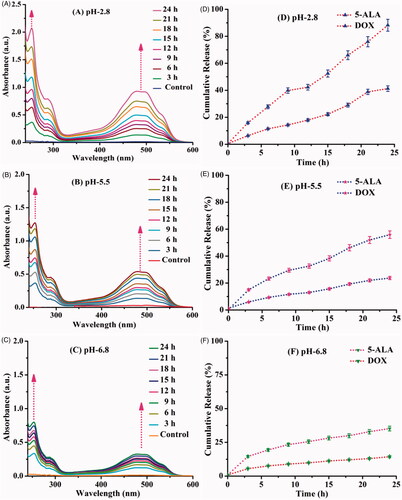
Figure 8. In vitro morphological changes of fibroblast (WS-1) cell line treated with 5-ALA CQD-Glu-β-CD and DOX/5-ALA-CQD-Glu-β-CD nanocarrier in a various time-dependent manner such as 6 h, 12 h, 18 h, and 24 h and IC50 concentration of 60 μg/mL at scale bar: ∼50 μm.
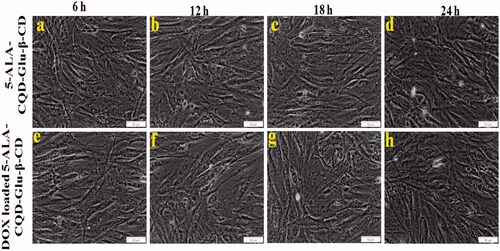
Figure 9. In vitro morphological changes by the chemo-photodynamic effect of breast cancer (MCF-7) cell treated with DOX/CQD-Glu-β-CD, 5-ALA-CQD-Glu-β-CD, and DOX/5-ALA-CQD-Glu-β-CD nanocarrier with and without irradiation in various time-dependent manners such as 6 h, 12 h, 18 h, and 24 h and IC50 concentration of 60 μg/mL at scale bar: ∼100 μm.
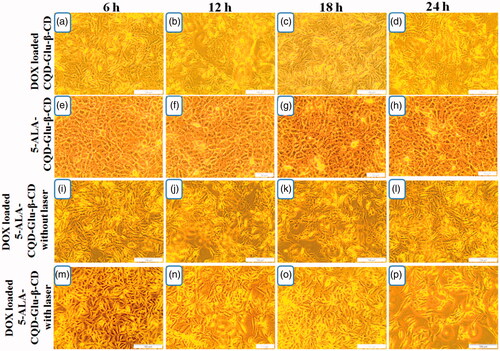
Figure 10. Fluorescent microscopic images of breast cancer (MCF-7) cell line incubated with DOX-loaded CQD-Glu-β-CD, and DOX-loaded 5-ALA-CQD-Glu-β-CD nanocarrier without and with laser irradiation in a various time-dependent manner such as 6 h, 12 h, 18 h, and 24 h and IC50 concentration of 60 μg/mL respectively at scale bar: ∼30 μm.
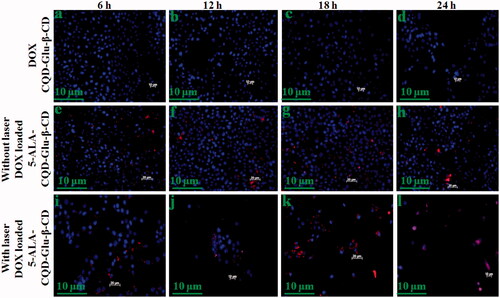
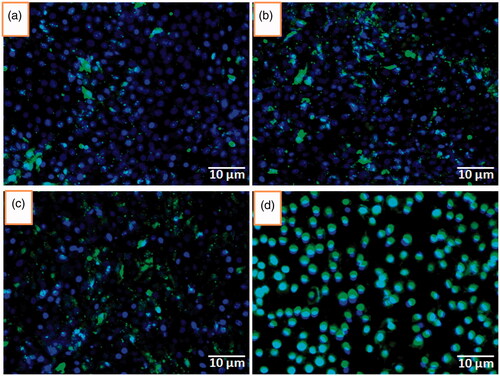
Figure 11. ROS level evaluation under irradiation in 6 h incubation with DOX/5-ALA-CQD-Glu-β-CD nanocarrier in breast cancer (MCF-7) cell line without (a–c) and with radiation (d–f) scale bar: ∼10 μm.
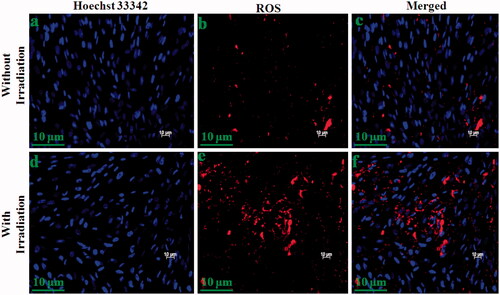
Figure 12. Qualitative assessment of fluorescence intensity associated with MCF-7 cells by the incubation of coumarin-6 loaded CQD-Glu-β-CD nanocarrier for 1 (a), 3 (b), 6 (c), and 12 h using blue filter (excitation wavelength 460–490 nm, emission 470 nm) in inverted fluorescence microscopy.