
Figures & data
Figure 1. Schematic illustration of the fabrication process and structure of F7-TPT-TSL and its applications in chemotherapy combined with hyperthermia.
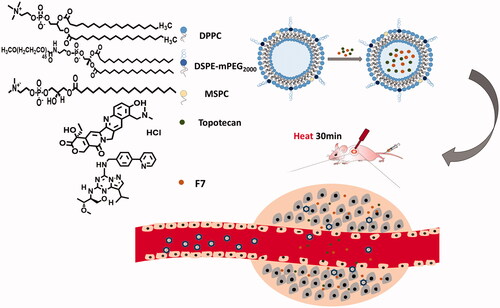
Table 1. Physicochemical properties of different liposome preparations.
Figure 2. TEM image (a), particle size distribution (b), and potential distribution (c) of F7-TPT-TSL.
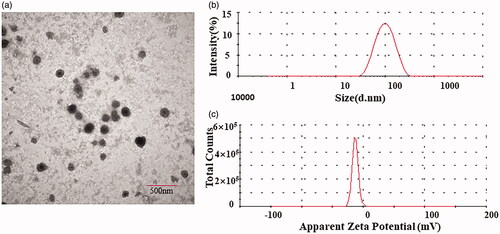
Figure 3. Differential scanning calorimetry phase transition temperature map.
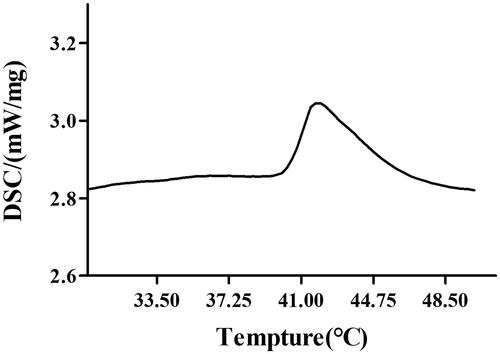
Figure 4. Temperature-triggered release behaviors of F7-TPT-TSL at 41 °C and 37 °C (n = 3).
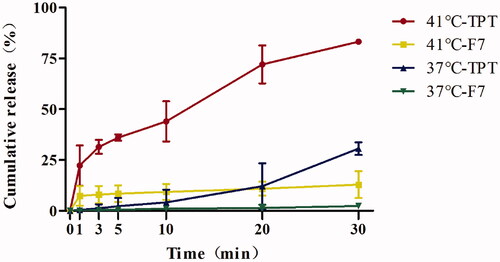
Figure 5. Transmission and backscattering profiles of liposome preparation by using a Turbiscan Lab@ Expert. The stability image (a) TSL, (b) F7-TPT-TSL, (c) F7 solution, (d) TPT solution diluted with water for 24 h at 25 °C, (e) TSL, (f) F7-TPT-TSL, (g) F7 solution, and (h) TPT solution diluted with serum for 24 h at 37 °C. Data are reported as a function of time and sample height (20–34 mm).
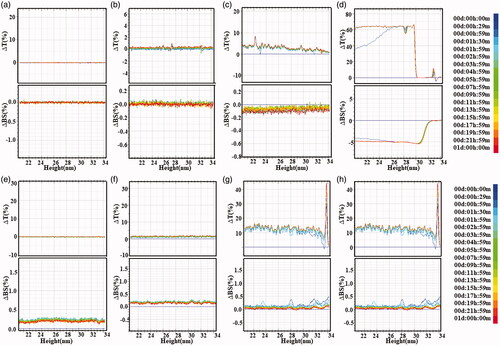
Figure 6. Cellular uptake of Cou6-DOX-solution and CD-TSL by H460 cells after 4 h incubation at 37 °C. Images of bright field, nuclei stained with DAPI (blue), 6-coumarin (green), DOX (red), and merged. Scale bar: 100 μm.
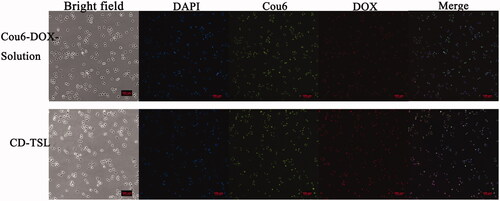
Figure 7. Apoptosis analysis of MCF-7 cells induced by F7 solution and F7-TSL for 24 h.
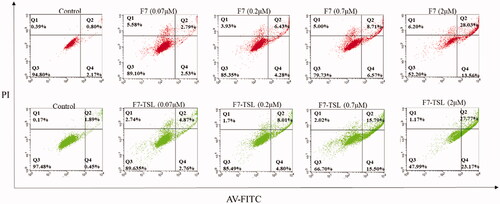
Figure 8. Interaction between F7 and TPT affects H460 cell growth. The graph shows CI values after treatment. CI < 1 represents a synergistic effect and CI > 1 indicates a less than additive effect of combined treatment. CI = 1 indicates that the effect is additive. CI values for the combination of F7 and TPT were calculated using CompuSyn software.
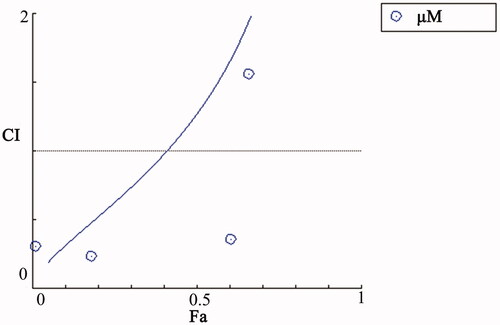
Figure 9. Cell viability of different preparations and concentrations. F7-TPT-TSL with TPT + F7 solution (p < .001); F7 – TPT-TSL/H with TPT + F7 solution (p < .001); and F7-TPT-TSL/H with F7 + TPT-TSL (p < .001).
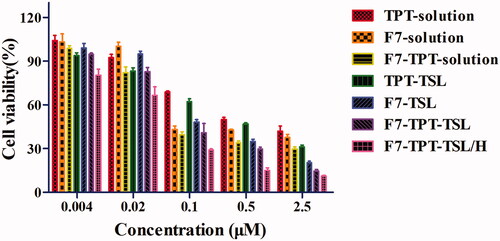
Table 2. IC50 values of different formulations.
Figure 10. (a) Anticancer efficacy in MCF-7 xenografts in female nude mice after treatment with varying formulations; (b) weights of dissected tumors at the end of treatment; (c) relative weight change of varying formulations in tumor-bearing nude mice; (d) tumor inhibition rate of varying formulations in tumor-bearing nude mice. **p < .01 (n = 6).
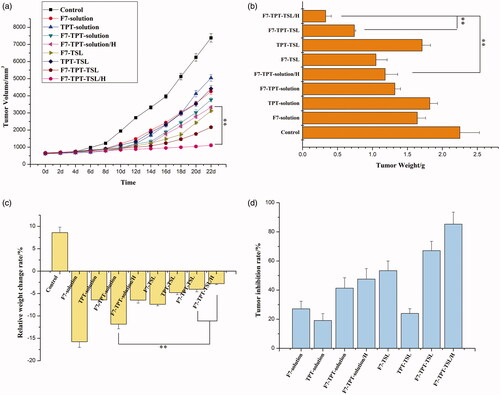
Table 3. Relative weight change of different formulations.