Figures & data
Figure 1. TEM micrographs of freshly prepared AmB-NLCs (A) uncoated-NLCs; (B) 5%Eu-NLCs, and (C) 7.5%Eu-NLCs.
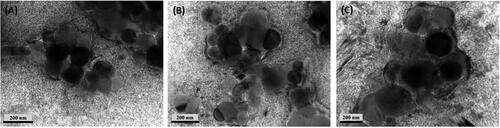
Figure 2. Photographs of uncoated NLCs and Eu-NLCs after lyophilization; (A) uncoated-NLCs; (B) 5%Eu-NLCs, and (C) 7.5%Eu-NLCs.
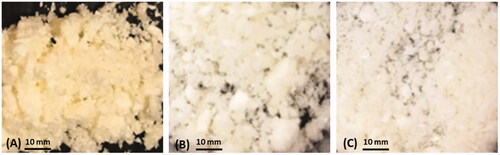
Table 1. Physicochemical characteristics of AmB-NLCs.
Table 2. Solubility of AmB-NLCs in different dissolution medium.
Figure 3. %Cumulative drug released from (![]()
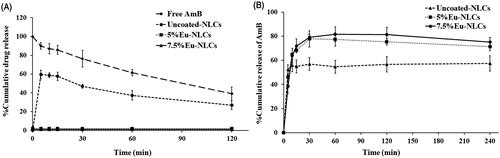
Table 3. The percentage of AmB in apical side, basolateral side, and cell monolayer after 6-h incubation.
Figure 4. Apparent permeability coefficient of uncoated NLCs and Eu-NLCs across Caco-2 cell monolayers. Data were presented as mean ± SD; n = 3. *, ** are different letters present statistical difference, p < 0.05 (one-way ANOVA followed by Tukey's test).
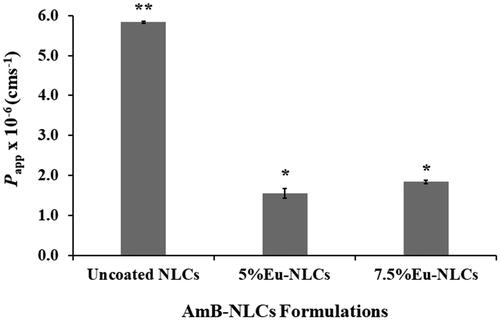
Table 4. Mean size of AmB-NLCs after 3 and 6 months at 4 °C and RT in the absence of the day light.
Table 5. Zeta potential of AmB-NLCs after 3 and 6 months at 4 °C and RT in the absence of the day light.
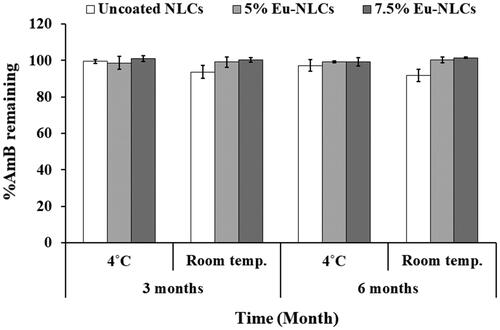
Figure 5. Percentage of drug remaining of uncoated NLCs and Eu-NLCs storage at 4 °C and RT after 3 and 6 months. (Data were presented as mean ± SD, n = 3).