Figures & data
Figure 1. The chemical structure of C086.
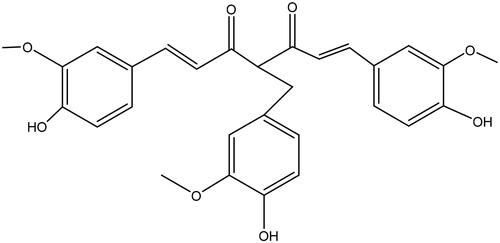
Figure 2. Physicochemical characterization of C086-SD. (A) Aqueous solubility. (B) Dissolution. (C) XRPD patterns, (D) DSC thermograms, and (E) FTIR spectra of pure C086, PVP K30, physical mixture (C086/PVP K30:1/6 (w/w)), and C086-SD (C086/PVP K30:1/6 (w/w)).
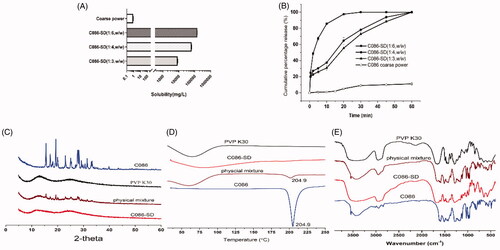
Figure 3. The stability of C086-SD. (A) Long-term stability of C086-SD Capsule at 25 °C ± 2 °C/60% RH ± 5% RH for 12 months. (B) Short-term stability of C086-SD in normal saline at 4 °C and 25 °C for 48 hours.
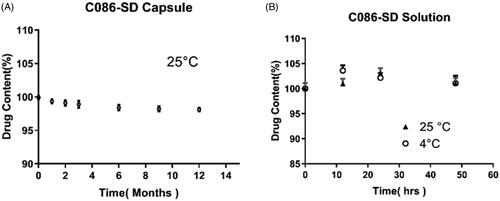
Figure 4. Mean plasma concentration-time curves of C086-Suspension and C086-SD following oral administration in rats (n = 6).
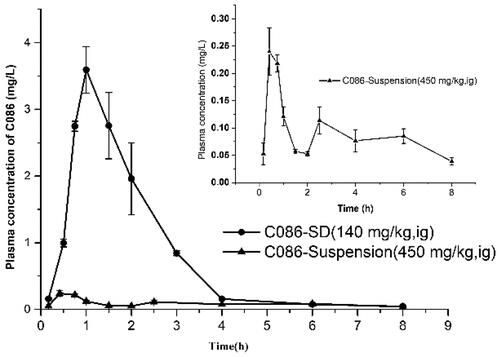
Table 1. Pharmacokinetic parameters of C086 following oral administration in rats (Mean ± SD, n = 6).
Figure 5. The tissue distribution of C086-SD following a single oral administration (140 mg/kg) using as a mice model (n = 3). (A) C086 concentration (µg/g) in key tissues at different times. (B) AUC0-t (µg/g*h) in key tissues. (C) MRT0-t (h) in key tissues.
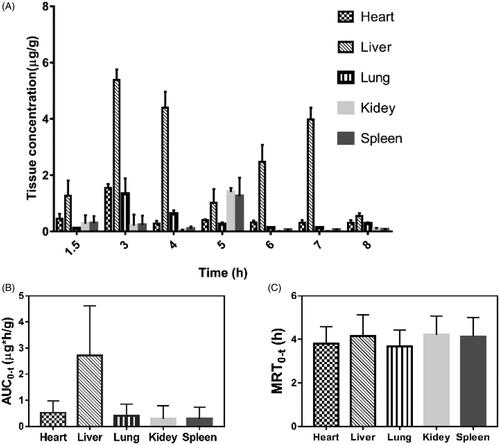
Table 2. The targeting efficiency of C086-SD following oral administration in mice (Mean ± SD, n = 3).
Figure 6. The anti-proliferative effects of C086 in vitro (n = 3). (A) The inhibition rate in HepG2 cells treated with indicated concentrations of C086-SD and C086 for 48 h and then assessed by an MTT assay, *p < .05 vs C086 at the same concentration. (B) The relative expression of phospho-MEK (p-MEK), MEK, phospho-ERK (p-ERK) and ERK in HepG2 cells were detected by using Western Blotting. (C) Histogram of the relative expression of proteins (density ratio of protein/β-actin): *p < .05 vs either control or C086.
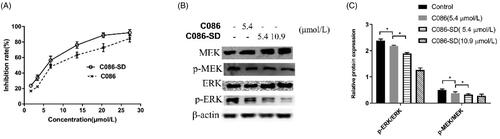
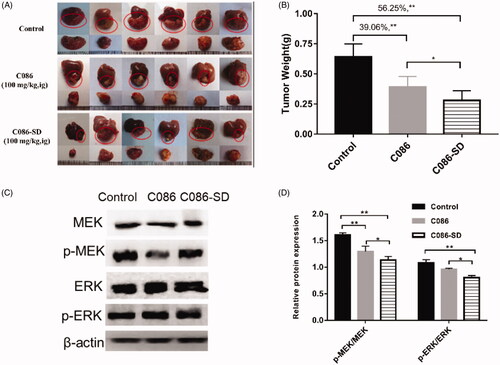
Figure 7. In vivo anti-cancer evaluation effect in the orthotopic hepatocellular carcinoma xenograft in BALB/C nude mice. (A) Photograph of HepG2 orthotopic tumors harvested on the last day of the experiment from nude mice (six per each group). (B) The weight of the harvested tumor: **p < .01 vs control and *p < .05 vs C086. (C) The expression of phospho-MEK (p-MEK) and phospho-ERK (p-ERK) in tumor tissue were detected by using Western Blotting. (D) Histogram of the relative expression of proteins (density ratio of protein/β-actin): *p < .05 and **p < .01 vs either control or C086. C086 = C086-Suspension.