Figures & data
Figure 1. Schematic of NM-aFGF-PEG-lips combined with UTMD mediated NM-aFGF for DCM therapy.
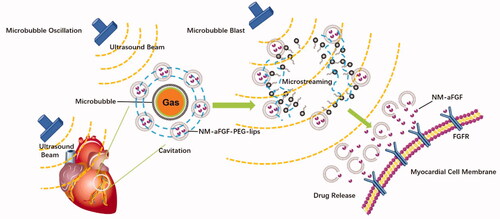
Figure 2. Characterization of blank and NM-aFGF-PEG-lips. (A) SEM of the blank liposomes. (B) SEM of the NM-aFGF-PEG-lips. (C) Size distribution of the blank and NM-aFGF-PEG-lips. NM-aFGF-PEG-lips: non-mitogenic acidic fibroblast growth factor; PEGylated: liposomes; SEM: scanning electron microscopy.
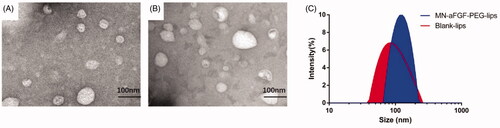
Figure 3. Effect of NM-aFGF-PEG-lips combine with UTMD treatment against myocardial injury. (A) Paraffin-embedded heart tissue was stained with hematoxylin and eosin and examined under microscope (400 × ,bar = 50μm). Arrows indicate cytoplasmic vacuolization, cardiomyocyte necrosis, myofibrillar loss and degeneration. (B) Representative transmission electron micrographs of cardiac tissues. (C) Quantitative analysis of the body weight of rats. N = 10 per group. (D) Quantitative analysis of the blood glucose of rats. N = 10 per group. Data are presented as Mean ± SD. ap < .05 vs normal control group. NM-aFGF-PEG-lips: non-mitogenic acidic fibroblast growth factor- PEGylated -liposomes; DM: diabetes mellitus; UTMD: ultrasound-targeted MB destruction; TEM: transmission electron micrographs.
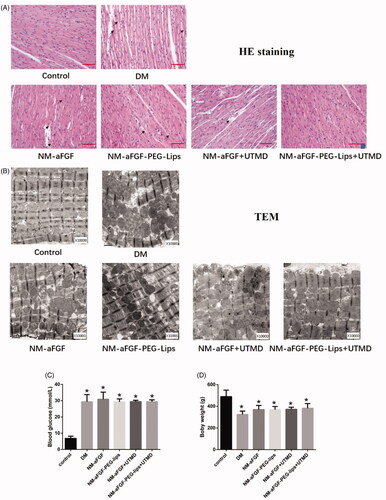
Table 1. Results of LVEDD, LVESD, LVEDV, LVESV, LVEF and LVFS in experimental animals (n = 10).
Figure 4. Effects of NM-aFGF-PEG-lips combine with UTMD on cardiac interstitial fibrosis of diabetic rats. (A–D) Representative images of Masson staining and immunohistochemistry staining with collagen I, collagen III and TGF-β1 (400 × ,bar = 50μm). (E) Quantitative analysis of collagen volume fraction (CVF) of rats. N = 10 per group. (F–H) Quantitative analyses of the expression of collagen I, collagen III and TGF-β1, respectively. N = 10 per group. Data are presented as Mean ± SD. ap < .05 vs control group; bp < .05 vs DM group; cp < .05 vs NM-aFGF-PEG-lips + UTMD. NM-aFGF-PEG-lips: non-mitogenic acidic fibroblast growth factor- PEGylated -liposomes; DM: diabetes mellitus; UTMD: ultrasound-targeted MB destruction.
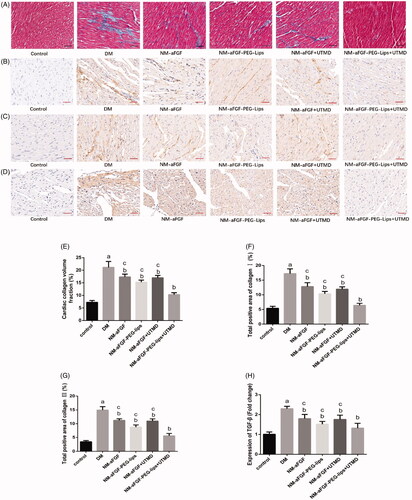
Figure 5. Effect of NM-aFGF-PEG-lips combine with UTMD on antioxidative stress in cardiac tissues. (A) SOD activity; (B) MDA activity; (C) GSH-Px activity and (D) Lipid hydroperoxide contents in the myocardial tissues. N = 10 per group. Data are presented as Mean ± SD. ap < .05 vs control group; bp < .05 vs DM group; cp < .05 vs NM-aFGF-PEG-lips + UTMD. NM-aFGF-PEG-lips, non-mitogenic acidic fibroblast growth factor- PEGylated -liposomes; DM: diabetes mellitus; UTMD: ultrasound-targeted MB destruction; SOD: Superoxide dismutase; MDA: malondialdehyde; GSH-Px: glutathione peroxidase.
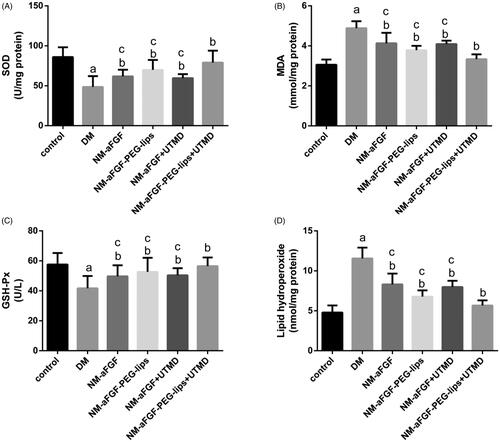
Figure 6. Effects of NM-aFGF-PEG-lips combine with UTMD on the protein expression levels of FGF1 and AKT-related signaling pathways of oxidative stress in cardiac tissues. (A) Expression of FGF1, p-AKT, AKT, p-GSK-3βand GSK-3α/βin cardiac tissues as measured by western blot analyses. (B–D) The quantification data of western blot for FGF1, p-AKT/AKT and p-GSK-3β/GSK-3α/β. (E) Expression of Nrf2, SOD2 and NQO1 in cardiac tissues as detected by western blot analyses. (F) The quantification data of western blot for Nrf2, SOD2 and NQO1. N = 10 per group. Data are presented as Mean ± SD. ap < .05 vs control group; bp < .05 vs DM group; cp < .05 vs NM-aFGF-PEG-lips + UTMD. NM-aFGF-PEG-lips: non-mitogenic acidic fibroblast growth factor- PEGylated -liposomes; DM: diabetes mellitus; UTMD: ultrasound-targeted MB destruction; GAPDH: glyceraldehyde 3-phosphate dehydrogenase.
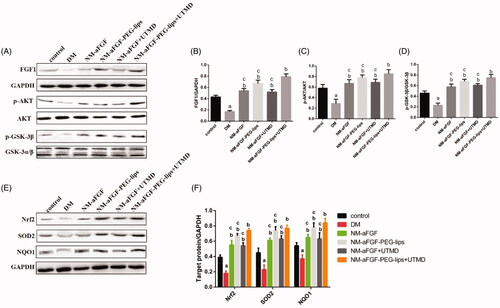
Figure 7. Effect of NM-aFGF-PEG-lips combine with UTMD on myocardial apoptosis induced by DM. (A) Representative images of TUNEL staining. Arrows indicate the nucleus of TUNEL positive cells (400 × ,bar = 50μm). (B) Representative images of immunohistochemistry staining with cleaved caspase-3 (400 × ,bar = 50μm). (C) Quantitative analyses of apoptosis index in myocardial tissues. (D) Quantitative analyses of the expression of cleaved caspase-3 protein in myocardial tissues. N = 10 per group. Data are presented as Mean ± SD. ap < .05 vs control group; bp < .05 vs DM group; cp < .05 vs NM-aFGF-PEG-lips + UTMD. NM-aFGF-PEG-lips: non-mitogenic acidic fibroblast growth factor- PEGylated -liposomes; DM: diabetes mellitus; UTMD: ultrasound-targeted MB destruction.
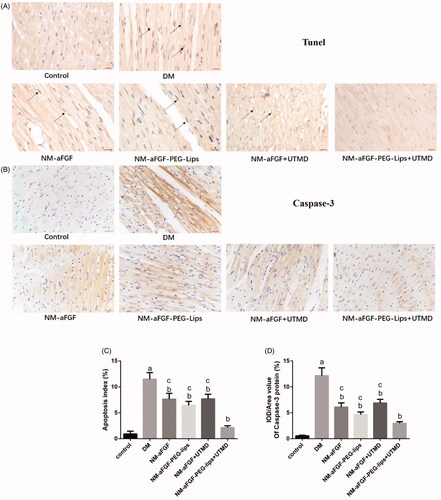
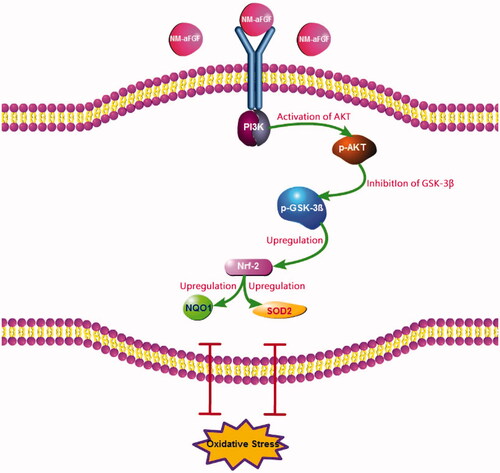
Figure 8. Molecular mechanism of the NM-aFGF mediated inhibition of oxidative stress in rats hearts challenged with DCM. NM-aFGF: non-mitogenic acidic fibroblast growth factor; DCM: diabetic cardiomyopathy.