Figures & data
Figure 1. (A) TEM image and (B) particle size distribution of TMZ/CUR-NLCs (2:1). (C) TEM image of and (D) particle size distribution of blank-NLCs.
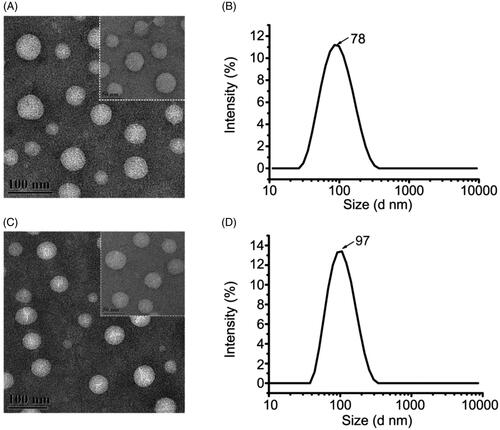
Figure 2. (A) In vitro drug release profiles of TMZ within 140 h and (B) 12.5 h. (C) In vitro drug release profiles of CUR within 140 h and (D) 12.5 h. (E) Proposed mechanism of sequential drug release.
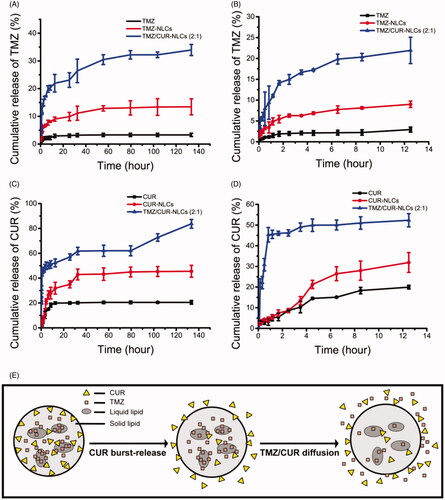
Figure 3. (A) Fluorescence images showing the intracellular uptake efficiency of TMZ/CUR-NLCs (2:1) and control (TMZ/CUR) after 4 h of co-cultured with C6 cells. (B) In vitro anticancer effect of TMZ/CUR-NLCs (2:1) on C6 cells and (C) cytotoxicity of TMZ/CUR-NLCs (2:1) on HEB cells, respectively. Scale bar: 50 μm. The results are shown in mean ± SD, n = 3. The statistical significance is expressed as ***p < .001, **p < .01.
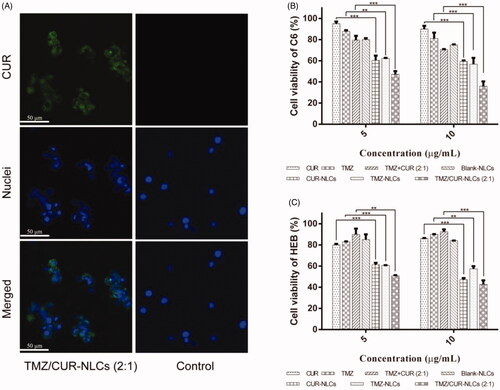
Figure 4. (A) Qualitative cell cycle progress and (C) quantitative cell cycle analysis of C6 cell lines treated with different samples. (B, D) Qualitative and quantitative apoptotic progression of C6 cell lines treated with control (TMZ/CUR), TMZ-NLCs, CUR-NLCs and TMZ/CUR-NLCs (2:1). (E) Illustration shows the proposed mechanism behind the synergistic anticancer effect of TMZ/CUR-NLCs (2:1) against glioma cells. The statistical significance is expressed as **p < .01, *p < .05.
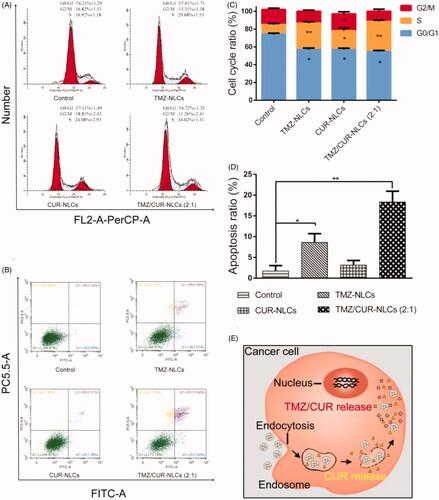
Figure 5. (A) The tumor volume, (B) body weight change ratio and (C) the tumor weight of mice after treatment with different samples. (D) Optical images showing tumors from treated mice. (E) In vivo distribution of TMZ/CUR-NLCs (2:1) and TMZ/CUR at 24 h. (F) The fluorescence intensity of TMZ/CUR-NLCs (2:1) and TMZ/CUR in different organs. The statistical significance is expressed as ***p < .001, **p < .01, *p < .05.
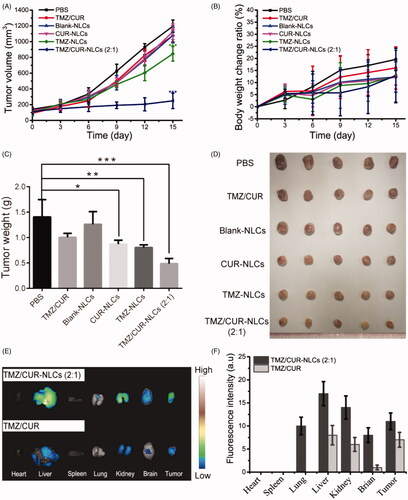
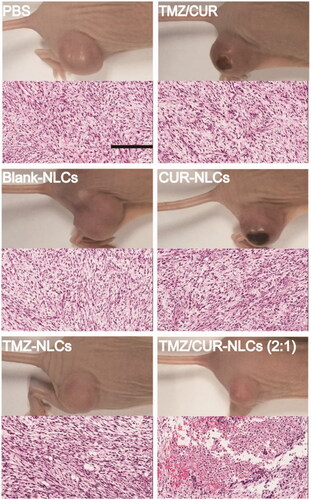
Figure 6. H&E staining of tumor sections separated from the treated mice. Scale bar: 200 μm.