
Figures & data
Figure 1. (A) Size distribution of magnolol-loaded mixed micelles(MMs); (B) size distribution of magnolol nanosuspensions(MNs); (C) TEM micrographs and image of MMs, scale bar = 0.5 μm; (D) TEM micrographs and image of MNs, scale bar = 0.5 μm.
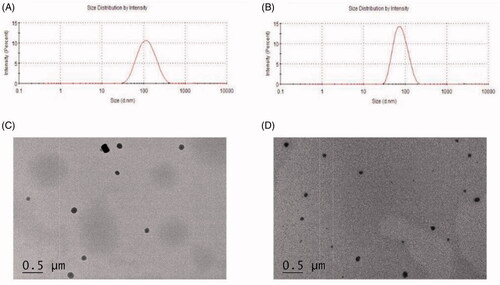
Figure 2. (A) In vitro release profiles of magnolol in phosphate buffer, pH 1.2; (B) in vitro release profiles of magnolol in phosphate buffer, pH 6.8.
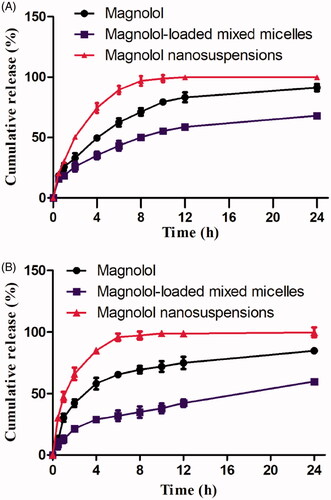
Figure 3. (A) Diluted stability of MMs (diluted 10, 50, 100, 200-fold); (B) diluted stability of MNs (diluted 10, 50, 100, 200-fold). **p < .01.
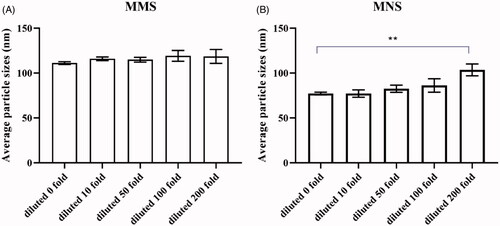
Figure 4. (A) Caco-2 cells were treated with various concentrations of magnolol for 2 h. Cell viability was measured by MTT assay. Data are presented as mean ± standard deviation; n = 3; (B) AP-BL and BL-AP permeability of magnolol, MMs, and MNs across the Caco-2 cell monolayer after 2 h incubation at 37 °C (mean ± standard deviation; n = 3). *p < .5; **p < .01.
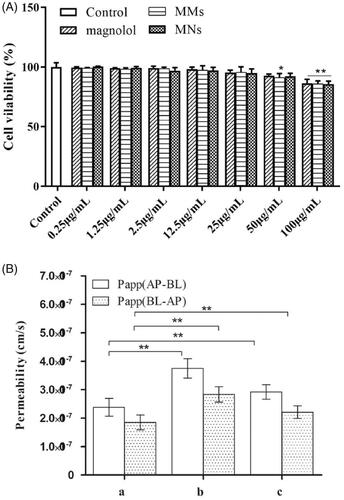
Figure 5. The plasma concentration-time curve of magnolol in rats after oral administration of magnolol, MMs and MNs (60 mg/kg, magnolol). Data are presented as mean ± standard deviation; n = 6.
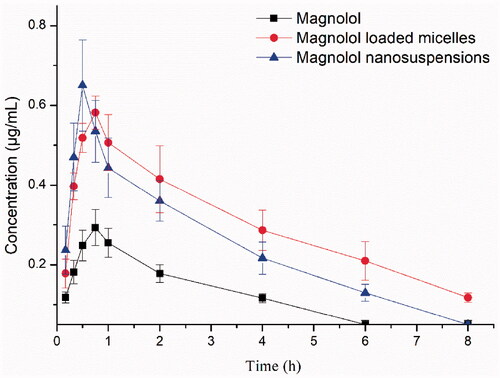
Table 1. Pharmacokinetic parameters of magnolol, magnolol-loaded mixed micelles (MMs) and magnolol nanosuspensions (MNs) (60 mg/kg, magnolol).