Figures & data
Figure 1. The SEM images of the VP16 implants (magnification ×1500). (A) The external surface of the VP16 implants. (B) The cross-section of the VP16 implants.
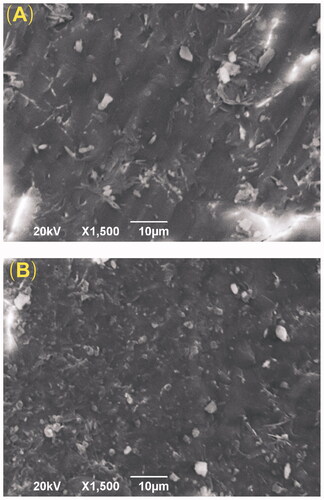
Figure 2. The drug release profiles of the VP16 implants. (A) The in vitro drug release profile of the VP16 implants (n = 6 for each time). (B) The in vivo drug release profile of the VP16 implants (n = 3 for each time). Data were shown as mean ± standard deviation.
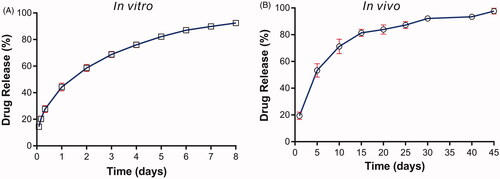
Figure 3. The DSC curves of the pure VP16, pure PLLA, pure PEG4000, VP16 implants and physical mixture of VP16, PLLA and PEG4000.
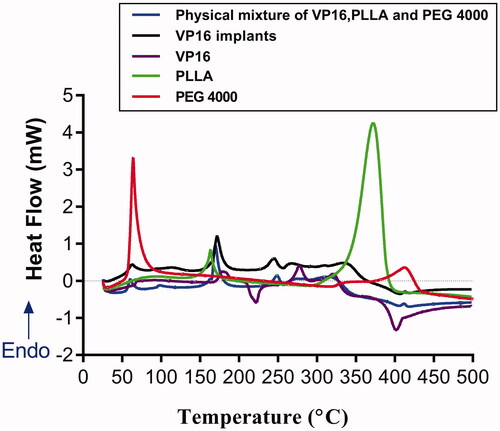
Figure 4. The FTIR spectra of the pure VP16, pure PLLA, pure PEG4000, VP16 implants and physical mixture of VP16, PLLA and PEG4000.
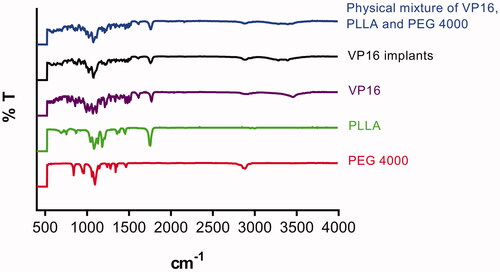
Figure 5. Plasma concentration–time curve for VP16 implants and VP16 solution.
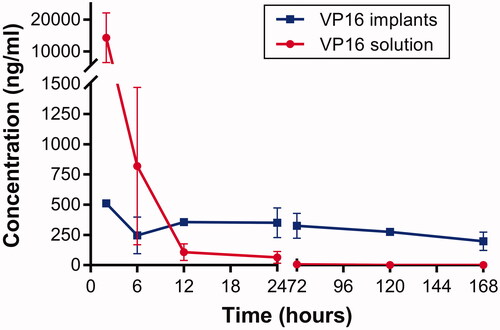
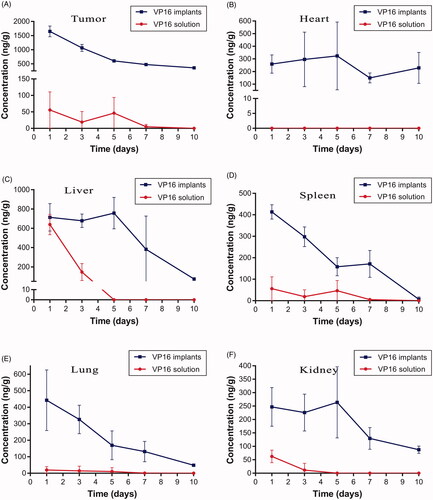
Figure 6. Tissue concentration–time curve for VP16 implants and VP16 solution. (A) Drug concentration in tumor at different time intervals. (B) Drug concentration in heart tissue at different time intervals. (C) Drug concentration in liver tissue at different time intervals. (D) Drug concentration in spleen tissue at different time intervals. (E) Drug concentration in lung tissue at different time intervals. (F) Drug concentration in kidney tissue at different time intervals.