Figures & data
Figure 1. Schematic representation of thyroid cancer cell targeting GEM-NPs. (A) Structure of Gemcitabine (GEM). Graphic design of the preparation process of GEM prodrug formations and self-assembly of GEM-NPs in water showing potential chemotherapy effect.
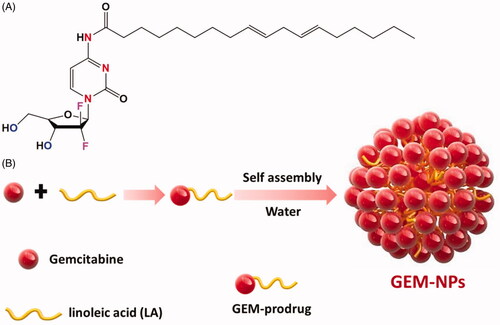
Figure 2. Characterization of GEM-NPs. (A) TEM image of GEM-NPs. Scale bar 100 nm. (B) Hydrodynamic parameter of GEM-NPs. (C) Diagram of hydrodynamic parameter of GEM-NPs. (D) Zeta potential examined via DLS analysis. (E) The solution containing GEM-NPs was dialyzed counter to PBS (pH 7.4) at 37 °C. In vitro drug release of GEM prodrug from GEM-NPs.
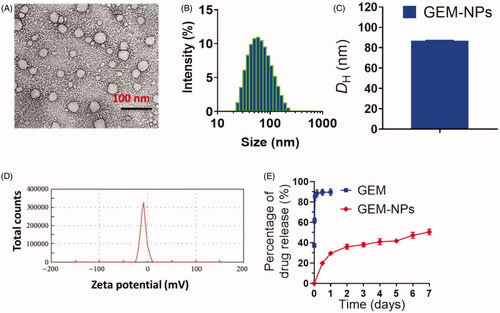
Figure 3. Subcellular localization of GEM-NPs with lysosomes in B-CPAP thyroid cancer cell lines at 10, 20, and 30 minutes incubation time. Scale bar = 20 μm.
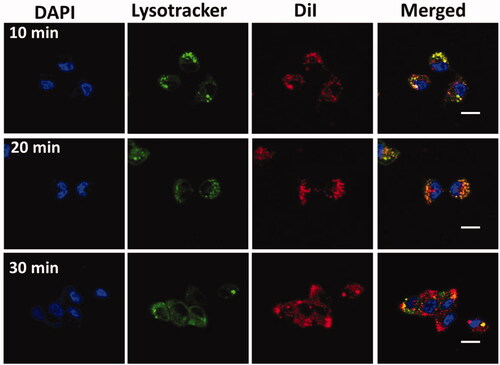
Figure 4. In vitro cytotoxicity of B-CPAP and FTC-133 thyroid cancer cell lines.
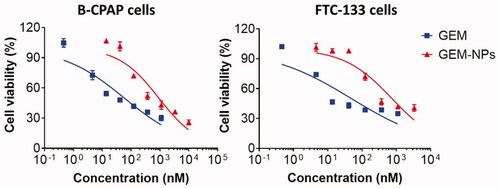
Figure 5. Dual AO/EB fluorescent staining of B-CPAP and FTC-133 thyroid cancer cell lines after treatment with GEM and GEM-NPs (IC50 concentration) for 24 h.
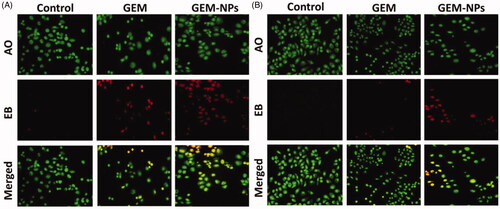
Figure 6. Nuclear staining of B-CPAP and FTC-133 thyroid cancer cell lines after treatment with GEM and GEM-NPs (IC50 concentration) for 24 h.
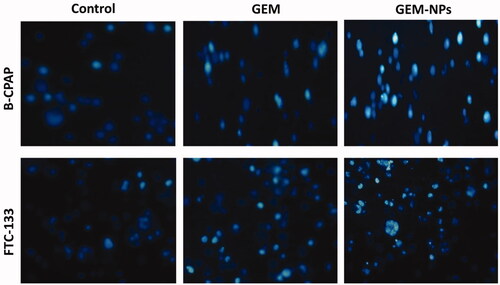
Figure 7. Apoptotic examination of B-CPAP and FTC-133 thyroid cancer cell lines using flow cytometry. The cells were treated with GEM and GEM-NPs (IC50 concentration) for 24 h, and stained with FITC annexin V/PI for flow cytometry investigation.
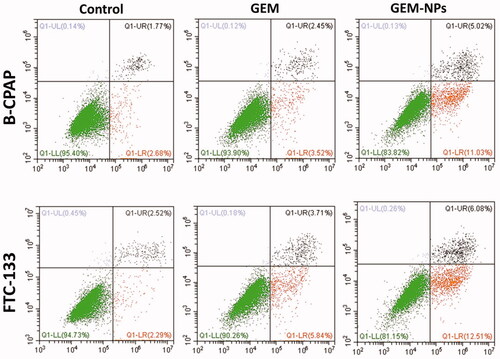
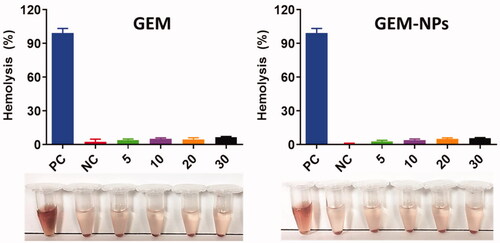
Figure 8. Hemolysis assay with different concentration of GEM and GEM-NPs. The result of hemolysis assay reveals that the insignificant hemolysis shows that it is extremely biocompatible for in vivo profiles.