
Figures & data
Table 1. Composition of the prepared BRU-loaded PLGA NPs.
Table 2. Selected critical independent variable and their level of variation.
Table 3. Software generated design matrix.
Figure 1. FTIR spectra of pure BRU, PEG, PLGA, PVA, and NP formulations prepared with PVA.
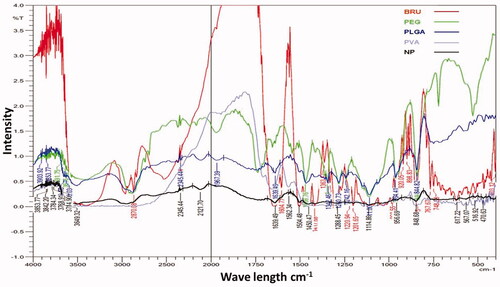
Figure 2. DSC thermogram of BRU, PLGA, PVA, and BRU-loaded PLGA NPs.
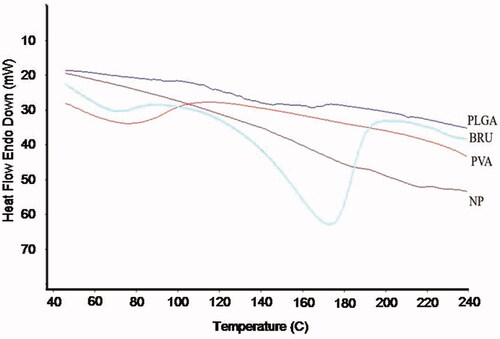
Figure 3. Size distribution, zeta potential, and scanning electron microscope of BRU-loaded PLGA NPs prepared with PVA. A: size distribution. B; zeta potential. C; scanning electron microscopic image.
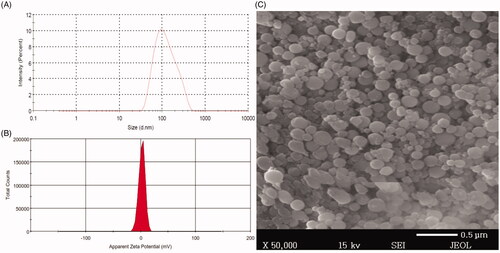
Table 4. The particle size, PDI, and zeta potential of prepared BRU-loaded PLGA NPs:.
Table 5. Entrapment efficiency and % yield of BRU-loaded PLGA NPs:.
Figure 4. Total amount of serum proteins associated on the surface of naked and PEG PLGA NPs prepared with PVA. Results are expressed as the mean with the bar showing S.D. of three experiments. p < .05, compared with naked counterpart.
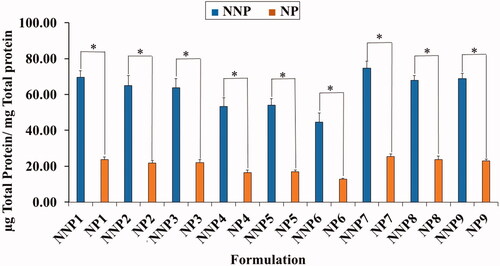
Figure 5. In vitro release studies of BRU A; from naked PLGA NPs prepared with PVA in PBS pH 7.4. B; from PEG PLGA NPs prepared with PVA in PBS pH 7.4. Results are expressed as the mean with the bar showing S.D. of three experiments. p < .05, compared with naked counterpart.
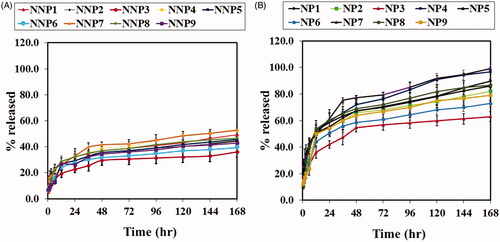
Table 6. Experimental design results of particle size, % yield and protein adsorbed.
Figure 6. Effect of PEGylation on particle size (a) 2D – contour plot and (b) 3D – response surface plot.
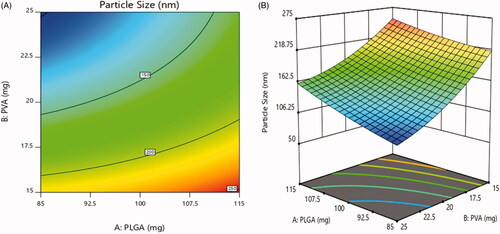
Figure 7. Effect on % yield (a) 2D – contour plot and (b) 3D – response surface plot.
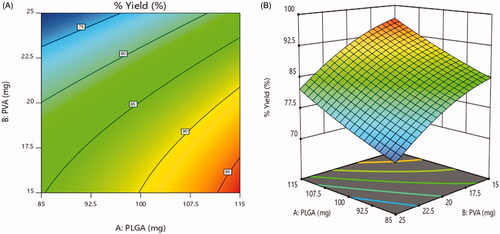
Figure 8. Effect on protein adsorbed (a) 2D – contour plot and (b) 3D – response surface plot.
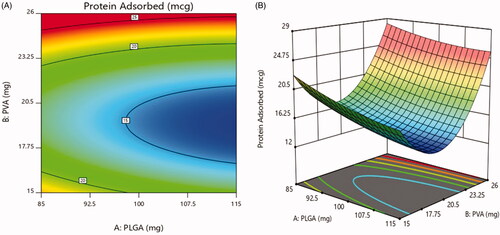
Figure 9. Design overlay plot.
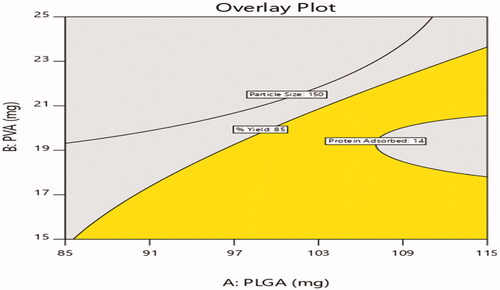
Table 7. Predicted and observed values of check point batches.
Figure 10. Effect of BRU-loaded PLGA NPs on tumor volume in MDA tumor bearing mice. * p < .05, compared with all groups under investigations.
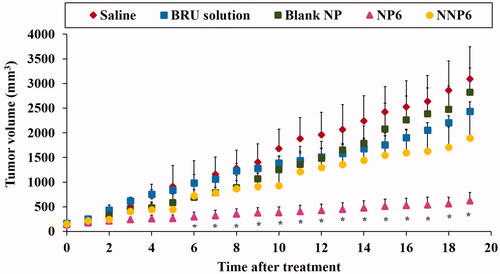
Figure 11. Effect of BRU-loaded PLGA NPs on survival of MDA tumor-bearing mice.
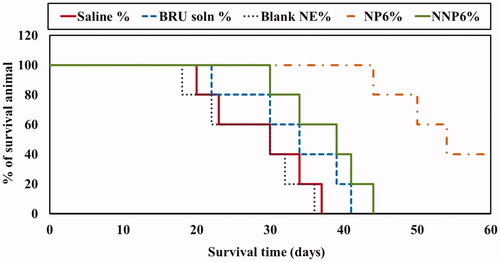
Table 8. Tumor growth rate and mean survival time (MST) values in tumor-bearing mice.