Figures & data
Figure 1. Illustration of the acidic-triggered lysosome escape PLP-NPs with self-amplifiable drug release for MDR CRC treatment.
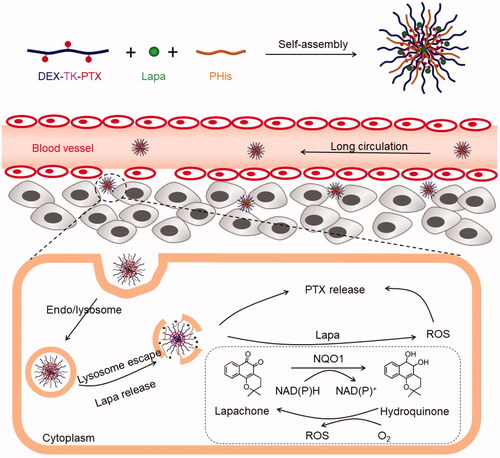
Figure 2. 1H NMR spectrum of PTX, TK-PTX, DEX, and DEX-TK-PTX in DMSO-d6.
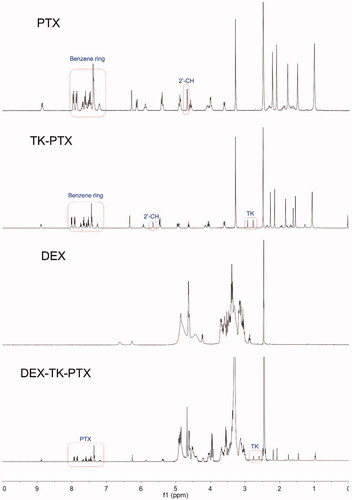
Figure 3. (A, B) Size change ratio (SCR, A) and Lapa release level (LRL, B) of NP1, NP2, NP3, NP4, NP5, NP6, and NP7, after incubation at pH 7.4, 6.5, and 5.5 for 8 h (n = 5). (C–D) Particle size of PLP-NPs and PP-NPs in PBS at pH 7.4 (C) and in RPMI-1640 containing 10% serum (D) (n = 5). (E–F) DLS results (E) and TEM images (F) of PLP-NPs cultured at pH 7.4 or pH 6.5 for 8 h.
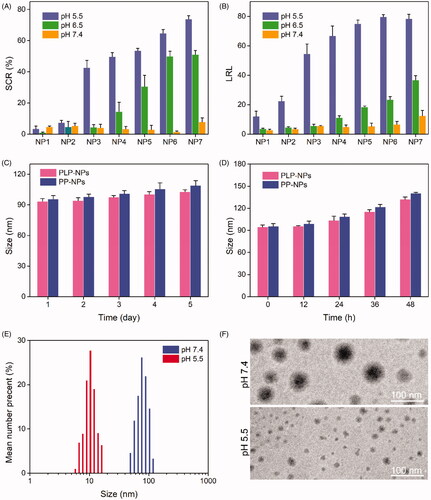
Table 1. Characterization of NPs (n = 5).
Figure 4. Stimuli-responsive drug release analysis. (A) Lapa release profile of the PLP-NPs at pH 7.4, 6.5, and 5.5, respectively (n = 5). (B) Cumulative release of PTX from PLP-NPs in the presence of 0, 0.1, and 10 mM H2O2 (n = 5).
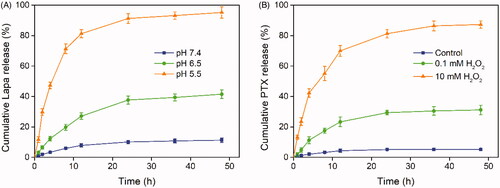
Figure 5. CLSM images of PHis-mediated lysosomal escape in HCT-8/PTX cells treated with coumarin-6-loaded PCP-NPs (with PHis) or PC-NPs (without PHis) for 1, 2, and 4 h, respectively.
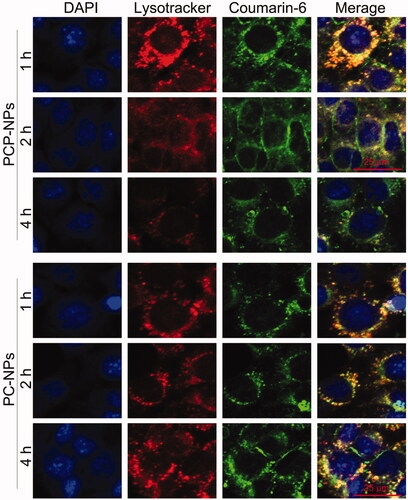
Figure 6. Lapa-mediated ROS production assay. (A) CLSM images of HCT-8/PTX cells treated with PTX, Lapa, PP-NPs, PLP-NPs, or PLP-NPs + DIC, and then stained with DCFH-DA (green fluorescence) and DAPI (blue fluorescence). (B, C) FCM detection of intracellular DCF intensity in cancer HCT-8/PTX cells (B) and normal NIH-3T3 (C) cells after treatment with PTX, Lapa, PP-NPs, PLP-NPs, or PLP-NPs + DIC (n = 5). (D, E) The amount of PTX released intracellularly in HCT-8/PTX (D) and NIH-3T3 cells (E) after treatment with PLP-NPs or PP-NPs for 4, 8, 12, or 24 h (n = 5). (F, G) The cytotoxicity of PLP-NPs or PP-NPs in HCT-8 cancer cells (F) and in normal NIH-3T3 cells (G) (n = 6).
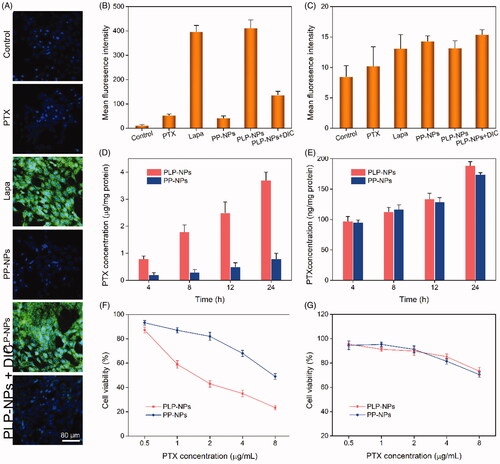
Figure 7. Investigating the ability to overcome MDR in vitro. (A, B) Cell viability of HCT-8 cells (A) and HCT-8/PTX cells (B) after incubation with PTX, Lapa, or PLP-NPs (n = 6). (C) The amount of PTX in HCT-8 and HCT-8/PTX cells after treatment with different drug formulations (n = 5). ‘Control’ represents cells incubated with free PTX. (D) The level of ATP in HCT-8/PTX cells after treatment with PTX, Lapa, PP-NPs, PLP-NPs, or PLP-NPs + DIC (n = 5). (E, F) Western blotting images (E) and quantitative analyses (F) of P-gp expression in HCT-8/PTX cells after treatment with PTX, Lapa, PP-NPs, PLP-NPs, or PLP-NPs + DIC (n = 5).
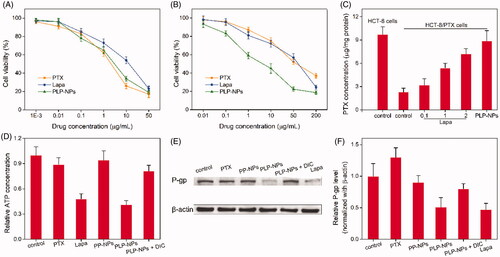
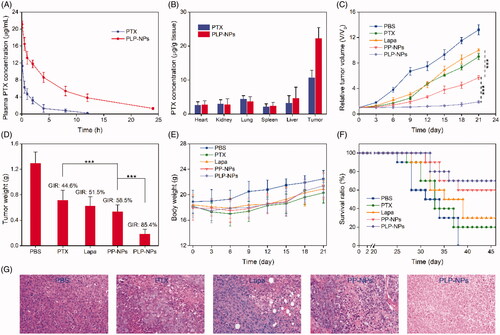
Figure 8. In vivo studies. (A) Plasma drug concentration as a function of time with PTX and PLP-NPs administration (n = 5). (B) PTX level in the major tissues following the administration of PTX and PLP-NPs for 12 h (n = 5). (C) Relative tumor volumes after treatment with different drug formulations (n = 6). (D) Tumor weight on day 21 in different drug treatment groups (n = 6). (E) The body weights of mice during the treatment period (n = 6). (F) Survival ratio of mice after different treatments (n = 6). (G) Hematoxylin and eosin (H&E) staining of tumor tissues after different treatments.