Figures & data
Figure 1. (A,B) Optimized TS-SLN characterization: (A) shows particle size and (B) TEM analysis.
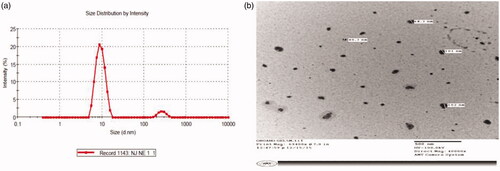
Figure 2. Thiopental sodium (TS), in vitro release from solid lipid nanoparticles SLN) and TS- solution at different time intervals (0–24 h) in phosphate buffer (pH 7.4) with dialysis method.
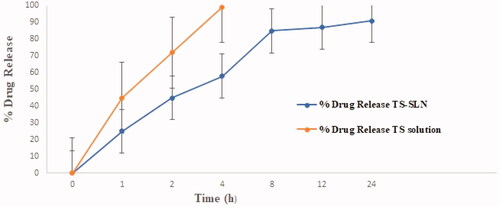
Table 1. Particle size, entrapment efficiency and loading capacity of SLN after storage at 25°C/60%RH.
Table 2. Particle size, entrapment efficiency and loading capacity of SLN after storage at 40°C/75%RH.
Figure 3. Exhibited the systolic blood pressure (SBP) in the normal and experimental group during the 8 weeks. Tail cuff method was used for the estimation of SBP. Data are presented as the mean ± SD, *p < .05, **p < .01 and ***p < .001.
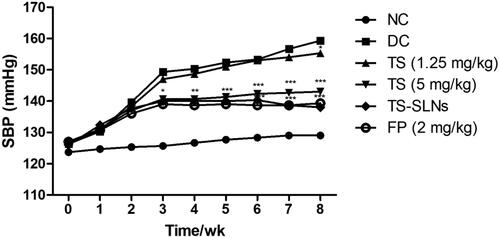
Figure 4. Exhibited the level of hemodynamics parameters in the normal and experimental group during the 8 weeks. (a) LVSP, (b) LVEDP, (c) +dp/dtmax and (d) −dp/dtmax Date are presented as the mean ± SD, *p < .05, **p < .01 and ***p < .001.
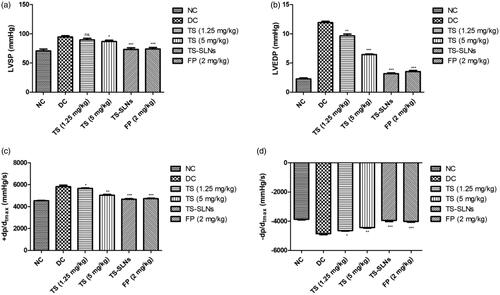
Figure 5. Exhibited the level of cardiac remodeling parameters in the normal and experimental group during the 8 weeks. (a) TAA, (b) LA, (c) CSA and (d) CSA/TAA. Data are presented as the mean ± SD, *p < .05, **p < .01 and ***p < .001.
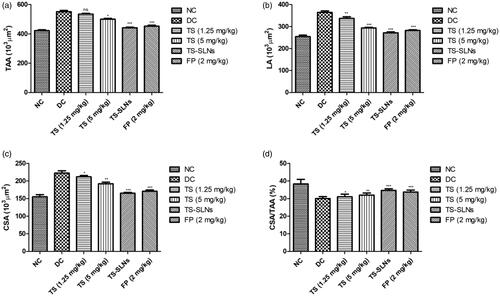
Figure 6. Exhibited the level of aortic parameters in the normal and experimental group during the 8 weeks. (a) Lumen, (b) Media, (c) M/L and (d) AR. Data are presented as the mean ± SD, *p < .05, **p < .01 and ***p < .001.
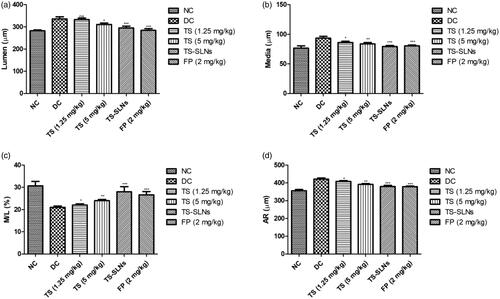
Figure 7. Exhibited the level of biochemical parameters in the normal and experimental group during the 8 weeks. (a) NO, (b) L-arginine, (c) BH4 and (d) ET-1. Data are presented as the mean ± SD, *p < .05, **p < .01 and ***p < .001.
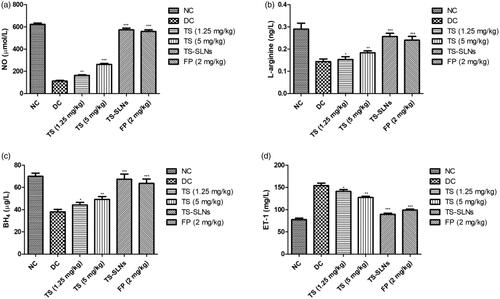
Figure 8. Exhibited the level of antioxidant parameters in the normal and experimental group during the 8 weeks. (a) SOD, (b) CAT, (c) GSH-Px and (d) MDA. Data are presented as the mean ± SD, *p < .05, **p < .01 and ***p < .001.
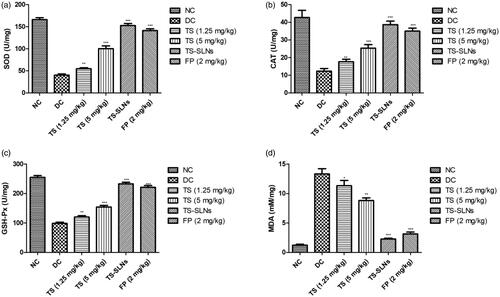
Figure 9. Exhibited the level of apoptosis marker in the normal and experimental group during the 8 weeks. (a) caspase-3, (b) caspase-8 and (c) caspase-9. Data are presented as the mean ± SD, *p < .05, **p < .01 and ***p < .001.
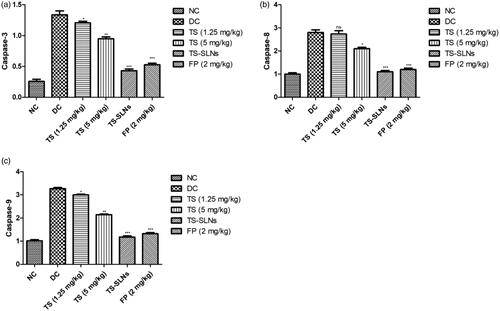
Figure 10. Exhibited the level of pro-inflammatory cytokines and inflammatory parameters in the normal and experimental group during the 8 weeks. (a) TNF-α, (b) IL-1β, (c) IL-6 and (d) NF-kB. Data are presented as the mean ± SD, *p < .05, **p < .01 and ***p < .001.
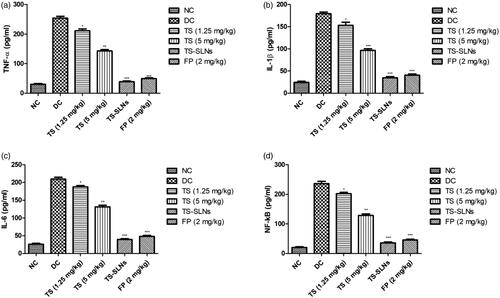
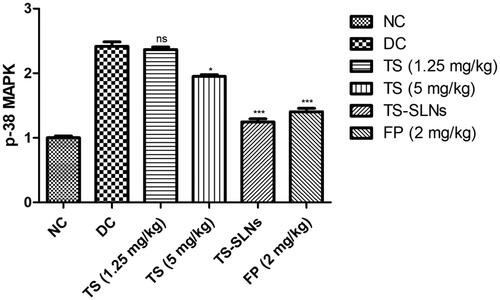
Figure 11. Exhibited the level of p-38 MAPK parameter in the normal and experimental group during the 8 weeks. Data are presented as the mean ± SD, *p < .05, **p < .01 and ***p < .001.