Figures & data
Table 1. Properties of RBCs, platelets, stem cells and leukocytes.
Figure 1. Strategies of RBCs loading. The therapeutic agents can be encapsulated into RBCs or attached to the surface of the RBCs by biotin, affinity ligands or nonspecific interactions, such as van der Waals forces, hydrogen bonds, electrostatic or hydrophobic forces. Reprinted with permission from Ma et al. (Citation2020). Copyright ©2017, Elsevier B.V.
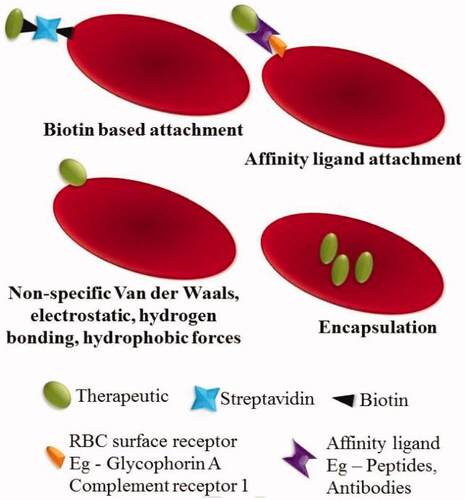
Figure 2. Schematic representation of the preparation of DOX-platelet-CD22 and its enhanced anti-tumor activity. DOX-platelet-CD22 can specifically target tumor cells by antigen-antibody binding and then internalize to exert cytotoxic effects. Reprinted with permission from Xu et al. (Citation2017). Copyright ©2017.
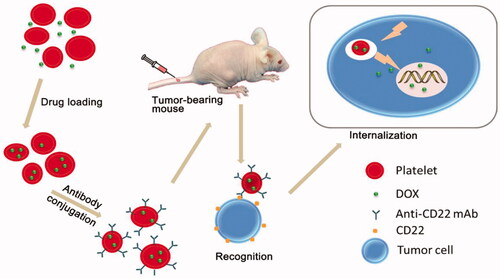
Table 2. Properties of neutrophils, and lymphocytes and monocytes/macrophage.
Figure 3. Neutrophil-mediated targeted delivery of nanotherapeutic drugs and neutrophil membrane-derived vesicles for targeted drug delivery. Reprinted with permission from Chu et al. (Citation2018). Copyright ©2018, Drug Delivery.
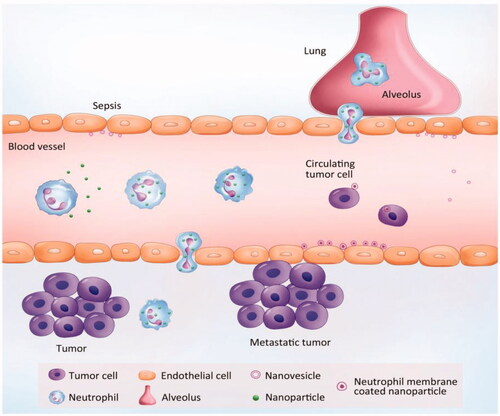
Figure 4. Schematic representation of NE-mediated anticancer drug delivery designed to inhibit postoperative glioma recurrence. (a) Schematic diagram of the preparation of PTX-CL/NE. SPC, soybean phosphatidylcholine; Chol, cholesterol; HG2C18, 1,5-dioctadecyl-N-histidyl-L-glutamic acid. (b) Schematic showing how PTX-CL/NE inhibits recurrence of postoperative glioma in mice. Surgical resection of the tumor expands the inflammatory signal in the brain, which allows PTX-CL/NE to target brain tumors, release PTX and inhibit glioma recurrence. (c) Schematic showing how PTX-CL/NEs can target glioma after intravenous injection of brain tumors have been surgically removed: (1) inflammatory factors direct the movement of PTX-CL/NE along the chemotaxis gradient; (2) PTX-CL/NE is transferred to the inflamed brain via BBB/BBTB; (3) PTX-CL/NEs penetrate the infiltrating tumor cells; (4) PTX-CL/NE is overactivated by concentrated cytokines and releases NETs, resulting in concomitant release of PTX-CL; (5) PTX-CL delivers PTX to infiltrating tumor cells to produce an anti-tumor effect. NET, which consists mainly of DNA from NE, is a fibrous extracellular matrix that is released by NEs and is overactivated by inflammatory cytokines. Reprinted with permission from Xue et al. (Citation2017). Copyright ©2017, Macmillan Publishers Limited, part of Springer Nature. All rights reserved.
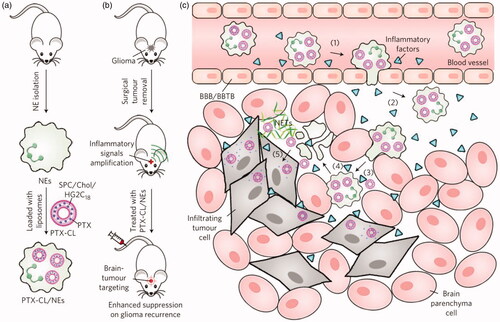
Figure 5. (a) T cell functionalization and cell-mediated delivery of SN-38 nanocapsules (NC) to tumors. (b) Bioluminescence images of tumor burden on day 16 of mice treated with PBS, SN-38, SN-38 nanocapsules and SN-38 nanocapsules were sputum on T cell vector (NC-T). (c) Overall survival. ***p < .001 by log-rank test. Reprinted with permission from Huang et al. (Citation2015). Copyright ©2015. American Association for the Advancement of Science.
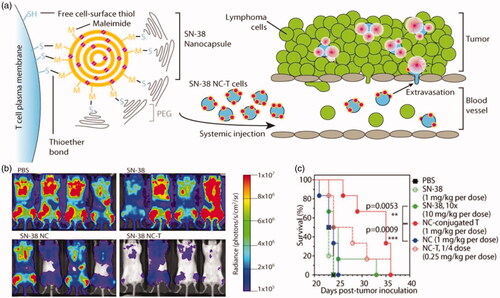
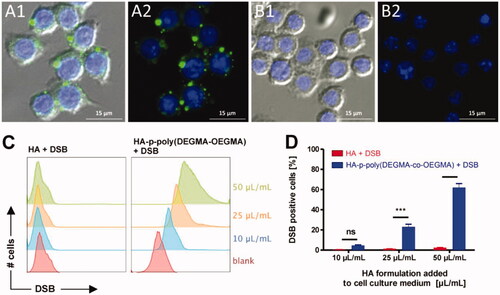
Figure 6. (A, B) Fluorescence microscopy images of RAW264.7 macrophages incubated with DSB loaded HA-p-poly(DEGMA-co-OEGMA) nanogels (A1, A2) and DSB with native HA (B1, B2). Cell nuclei are stained blue with DAPI and DSB is visualized in the green fluorescence channel. The right panels show only the fluorescence channels. The left panel depicts an additional overlay with the DIC channel. Bottom: (C) flow cytometry histograms recorded from RAW264.7 macrophages that were incubated for 1 h with different amounts of the respective HA/DSB formulations (i.e. with DSB loaded HA-p-poly(DEGMA-co-OEGMA) nanogels and DBS in the presence of native HA) per mL cell culture medium; (D) corresponding graphs depicting the percentage of RAW264.7 macrophages that were found positive for DSB after 1 h incubation with the respective HA/DSB formulations (n = 3, ***p < .001). Reprinted with permission from Fernandes Stefanello et al. (Citation2014). Copyright © 2014 Acta Materialia Inc. Published by Elsevier Ltd.