
Figures & data
Figure 1. Uses of optical/CT along the preclinical translational spectrum. 3D OI/ CT imaging allows for precise localization of the intracranial implanted NIR-labeled GBM cells. After GBM cell implantation, 3D OI/CT imaging enables visualization of the tumor growth and intracranial location of the tumor. 3D OI/CT imaging using Cy7 labeled albumin validates BBB opening with HIFU or CED drug delivery allowing visualization of drug distribution.
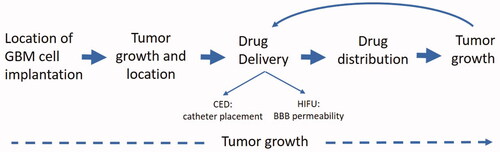
Figure 2. 3D optical/CT localization of GBM cells labeled with Cy7. GBM cells were stereotactically implanted intracranially after being labeled with Cy7 and imaged with 3D OI/CT. (A) Coronal and sagittal projections of 3D optical/CT scans of the mouse brains demonstrating successful placement of labeled GBM cells but at different depths, with mouse 2 demonstrating a more inferior placement compared to mouse 1. (B) Same mice as (A) imaged 8 days post cell implantation, demonstrating near complete resolution of signal. (C, left panel) Cy7-fluorescence intensity in injected side versus un-injected side. (C, right panel) Cy7-fluorescence signal disappeared by day 8 after injection.
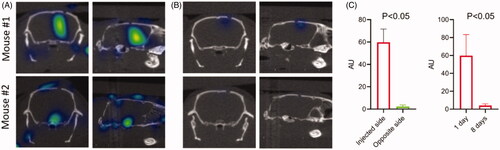
Figure 3. Validation of 3D optical/CT localization of Cy7 labeled mouse albumin (Cy7ALB) directly injected into the brain of a normal mouse. 5 µl of Cy7ALB was injected into right hemisphere. (A) Cy7 epi fluorescent images of 2 different mice 24 h after intracranial injection of Cy7ALB showing accumulation on 2D (left) and 3D OI/CT (right), confirming intracranial placement of infused Cy7ALB in the top mouse but superficial localization in the bottom mouse. Note that the intensity on the epi fluorescent images is heavily influenced by how close to the surface the dye is located rather than amount of Cy7ALB present, due to tissue attenuation of the Cy7 signal. (B) Confirmation of localization of Cy7ALB 3D OI/CT on sections of mouse brain imaged post necropsy. Mice were implanted with Cy7ALB at 2.5 mm depth (top, n = 3) and 1 mm depth (bottom, n = 3) and imaged with 3D OI/CT 24 h after injection (left panels). Immediately after imaging, mice were euthanized and their brains were sectioned and imaged (right panels) to confirm localization of 3D OI/CT images. (C) Coronal 3D OI/CT images of a representative mouse 24 h (top) and 96 h (bottom) after injection of Cy7ALB signal, demonstrating intracranial signal 24 h after injection but not at 96 h, indicating the potential to reimage subsequent infusions. Quantification of the results is shown on the right (n = 4).
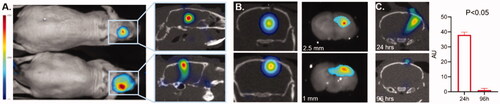
Figure 4. Detection of BBB permeability with systemically injected Cy7ALB. BBB permeability was accomplished using the previously reported intracranial LPS model to induce inflammatory changes. 24 h after stereotactic LPS injection, Cy7ALB was injected IV and imaged 24 h post injection with 3D OI/CT. Coronal images are shown of (A) control with no intracranial injection, (B) control with intracranial injection of saline, and (C) mouse injected intracranially with LPS. Images demonstrate a lack of Cy7ALB in the control brain with an intact BBB, minimal BBB permeability in the saline infused brain and substantial permeability in LPS-infused mouse brain, indicating potential of OI/CT to detect intravenously injected Cy7ALB when the BBB is compromised.
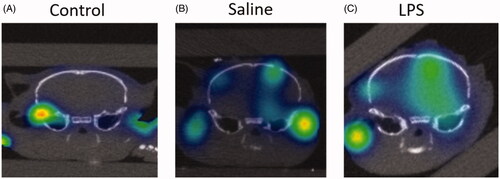
Figure 5. 3D optical/CT visualization of glioblastoma in a mouse brain using systemically injected Cy7ALB. (A) Bioluminescence (biolum) image of mouse with implanted G48a-FLuc cells. (B) Coronal (top) and sagittal (bottom) views of microCT with OmnipaqueTM contrast (left panels) and 3D optical/CT (right panels) 24 h post systemic injection of Cy7ALB. Images demonstrate intracranial Cy7ALB accumulation in the mouse with growing G48a GBM caused by BBB permeability in the region of the tumor, corresponding to the CT contrast accumulation. (C) Tumor to background ratio obtained using Cy7-albumin 3D optical detection (Cy7ALB) and CT with contrast (CT). (D) After imaging, mice were injected with Evan’s blue (EB) dye and euthanized 4 h later to confirm BBB penetration. Photograph of EB and epi fluorescent images of the post mortem brain of a control non tumor bearing mouse (top) along with brain of the GBM-bearing mouse from images A and B (bottom), confirming BBB permeability and Cy7ALB accumulation, respectively.
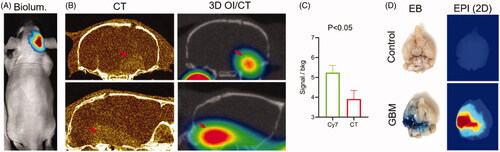
Figure 6. Detection of blood–brain barrier (BBB) permeability after high intensity focused ultrasound (HIFU). (A) Images of dissected brains from mice treated with HIFU pressure at 0.7 (top) and 0.5 (bottom) MPa. Following HIFU, animals were immediately injected IV with a mixture of Cy7ALB (yellow arrows) and Evan’s blue (red arrows). Brains were dissected 24 h after treatment. Note the considerably stronger Cy7 fluorescence and Evan’s blue staining in the brains of mice subjected to HIFU at 0.7 power compared to 0.6. (B) Quantification of Cy7ALB in brains of HIFU treated mice. (C) 3D OI/CT image of Cy7ALB accumulation (yellow arrow) in the brain of mouse 24 h after HIFU treatment shown in coronal (top) and axial (bottom) projections.
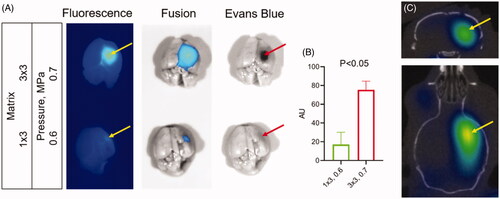
Figure 7. Systemic therapeutic delivery through HIFU induced BBB permeability using PET/CT and optical/CT. Mice were treated with HIFU with microbubble infusion and immediately injected IV with Cy7-anti-PD1 and [89Zr]-anti-PD1 antibodies (see methods for details, bottom panels). Control mice were not exposed to HIFU (top panels). (A) 30 min static PET/CT images were obtained 24 h after injection and shown in axial projection. (B) After PET/CT images were aquired, mice were scanned with 3D optical/CT imaging to detect intracranial Cy7-anti-PD1 antibody accumulation, shown in coronal projection. (C) Immediately after 3D optical/CT scaning brains were dissected and both PET and epifluorescent optical images were taken. PET (D) and optical (E) uptake were quantitated and analyzed for statistical significance.
![Figure 7. Systemic therapeutic delivery through HIFU induced BBB permeability using PET/CT and optical/CT. Mice were treated with HIFU with microbubble infusion and immediately injected IV with Cy7-anti-PD1 and [89Zr]-anti-PD1 antibodies (see methods for details, bottom panels). Control mice were not exposed to HIFU (top panels). (A) 30 min static PET/CT images were obtained 24 h after injection and shown in axial projection. (B) After PET/CT images were aquired, mice were scanned with 3D optical/CT imaging to detect intracranial Cy7-anti-PD1 antibody accumulation, shown in coronal projection. (C) Immediately after 3D optical/CT scaning brains were dissected and both PET and epifluorescent optical images were taken. PET (D) and optical (E) uptake were quantitated and analyzed for statistical significance.](/cms/asset/fe149f9a-3ca7-4493-a88d-bb7163fe2b6b/idrd_a_1833381_f0007_c.jpg)