Figures & data
Figure 1. (A) Schematic illustration of an etoposide/low-molecular-weight methylcellulose (ETP/LMC)-loaded water-in-oil-in-water (w/o/w) nanoemulsion incorporating an ionic complex of Nα-deoxycholyl-l-lysyl-methylester and 1,2-didecanoyl-sn-glycero-3-phosphate (sodium salt) (DCK–PA) (ELNE#7). (B) Transmission electron micrographic image of ELNE#7. Scale bar, 100 nm.
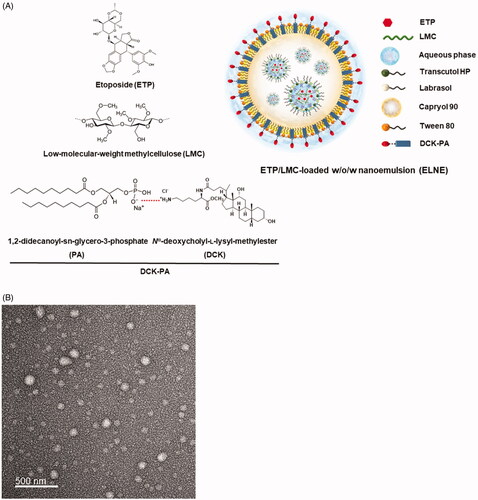
Table 1. Effective and apparent permeabilities of ETP, ETP/LMC, ETP emulsion, ENE, and ELNE formulations.
Figure 2. Confocal laser scanning microscopic images of the cellular uptake of different coumarin-6-co-loaded etoposide (ETP) vehicles. (A) Cellular uptake of coumarin-6-co-loaded ETP/LMC solution, coumarin-6-co-loaded ETP/LMC in 0.3% NaCMC, coumarin-6-loaded ENE and ELNE#1, and coumarin-6-loaded ELNE incorporating an ionic complex of Nα-deoxycholyl-l-lysyl-methylester and 1,2-didecanoyl-sn-glycero-3-phosphate (sodium salt) (ELNE#7) by Caco-2 cells. Cellular uptake of coumarin-6-co-loaded ETP/LMC solution, coumarin-6-co-loaded ETP/LMC in 0.3% NaCMC, coumarin-6-loaded ENE and ELNE#1, and coumarin-6-loaded ELNE incorporating an ionic complex of Nα-deoxycholyl-l-lysyl-methylester and 1,2-didecanoyl-sn-glycero-3-phosphate (sodium salt) (ELNE#6 and #7) by (B) MDCK cells or (C) ASBT-transfected MDCK cells. Scale bar, 20 µm.
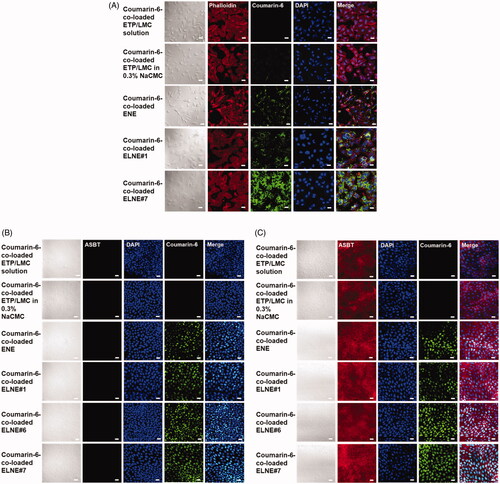
Figure 3. Relative apparent permeability (Papp) values of ELNE#7 without inhibitors (control) and in the presence of various biochemical inhibitors of specific pathways across Caco-2/HT-29-MTX-E12 monolayers. (A) Papp of ELNE#7 across Caco2/HT-29-MTX-E12 monolayers after incubation with various transport inhibitors. (B) Papp of ELNE#7 in the presence of actinomycin D, clofazimine, or both (actinomycin D + clofazimine). Each value represents the mean ± standard deviation (n= 4). **p<.01, ***p<.001 compared with the Papp of ELNE#7 in the absence of all inhibitors (untreated control). (C) Papp ratio of ETP/LMC in water and ELNE#7 in both apical to basolateral (AB) and basolateral to apical (BA) directions in the absence of all inhibitors (net efflux ratio; Papp, BA, w/o inhibitors/Papp, AB, w/o inhibitors). (D) Relative Papp ratios of ELNE#7 in the presence of cyclosporine A (Cys A) (net Papp ratio; Papp, AB, with Cys A/Papp, AB, w/o inhibitors). Each value represents the mean ± standard deviation (n= 4). ***p<.001 compared with the Papp of ETP/LMC solution. (E) Papp of ELNE#7 with or without EGTA in the presence or absence of all inhibitors except Cys A. Each value represents the mean ± standard deviation (n= 4). *p<.05, ***p<.001 compared with the Papp of ELNE#7 without EGTA in the absence of all inhibitors (untreated control); #p<.05, ###p<.001 compared with the Papp of ELNE#7 without EGTA in the presence of all inhibitors except Cys A; $$$p<.001 compared with the Papp of ELNE#7 with EGTA in the absence of all inhibitors except Cys A.
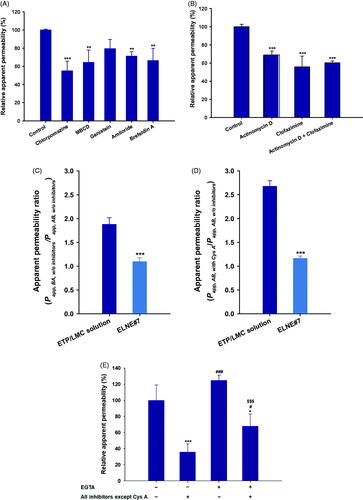
Figure 4. In vitro cytotoxic effects of ETP dispersed in water, ETP/LMC solution, ETP-IV, ETP emulsion, and ELNE#7 on (A) LLC and (B) A549 cells after incubation for 24 hours. Each value represents the mean ± standard deviation (n= 4).
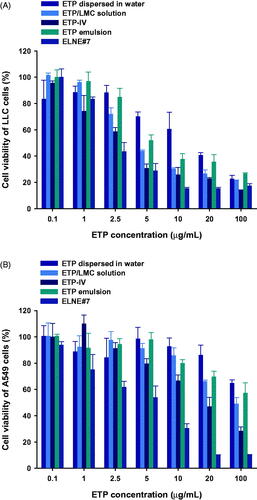
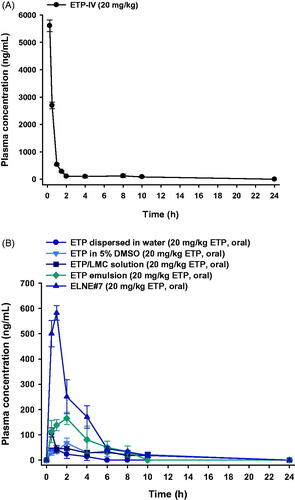
Figure 5. Mean plasma concentration–time profiles of etoposide (ETP) in rats after (A) a single intravenous (IV) administration of 20 mg/kg ETP (ETP-IV) and (B) oral administration of an aqueous suspension of 20 mg/kg ETP (ETP dispersed in water); 5% DMSO solution of 20 mg/kg ETP (ETP in 5% DMSO); aqueous solution of 20 mg/kg ETP/LMC (ETP/LMC solution); ETP-incorporating emulsion (ETP emulsion); and ETP/LMC-loaded nanoemulsion (ELNE) incorporating an ionic complex of Nα-deoxycholyl-l-lysyl-methylester and 1,2-didecanoyl-sn-glycero-3-phosphate (sodium salt) (DCK–PA) (ELNE#7) as 20 mg/kg ETP. Each value represents the mean ± standard deviation (n= 4 for each group).