Figures & data
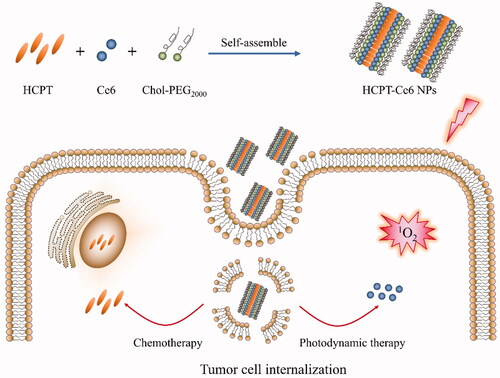
Scheme 1. Illustration of HCPT/Ce6 NPs and the NPs guided chemo-PDT combinational therapy.

Figure 1. The particle size distribution of HCPT/Ce6 NPs before vs. after storage determined by DLS results (A) and the particle size changes of HCPT/Ce6 NPs during storage (n = 3) (B); SEM images of HCPT/Ce6 NPs (C); TEM images of HCPT/Ce6 NPs (D).
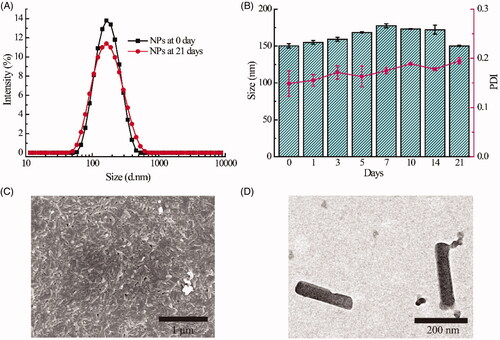
Figure 2. The UV-vis absorption spectra (A) and fluorescence spectra (B) of HCPT NPs, Ce6 NPs and HCPT/Ce6 NPs; FT-IR spectra (C) of (a) raw HCPT, (b) raw Ce6, (c) raw Chol-PEG2000, (d) physical mixture of HCPT, Ce6 and Chol-PEG2000, and (e) HCPT/Ce6 NPs; Cumulative release profiles of HCPT and Ce6 from HCPT/Ce6 NPs in 0.1 M PBS (pH 7.4) involving 1% (w/v) SDS (n = 3) (D).
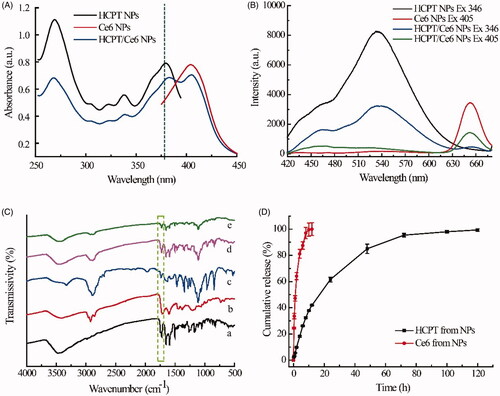
Figure 3. The representative fluorescent microcopy images of intracellular singlet oxygen generation by DCFH-DA in 4T1 cells incubated with HCPT/Ce6 NPs (with laser) for different laser irradiation times (A) and incubated with different formulations (B). Scar bar: 100 µm.
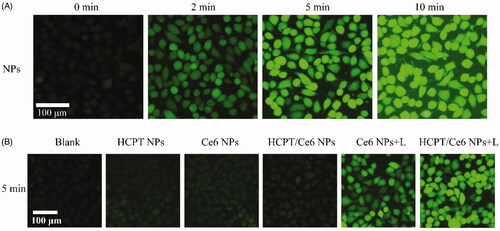
Figure 4. In vitro cytotoxicity of HCPT/Ce6 NPs (with laser) toward 4T1 cells after incubation for 48 h (n = 6) (A); Combination index (CI) values of HCPT/Ce6 NPs (with laser) against 4T1 cells (B); Cellular uptake detection of HCPT/Ce6 NPs toward 4T1 cells at different HCPT concentrations and incubated times (n = 3) (C); Cellular uptake detection of HCPT/Ce6 NPs toward 4T1 cells with different cellular uptake inhibitors (n = 3) (D). **p < .001 vs. HCPT/Ce6 NPs without cellular uptake inhibitors, *p < .05 vs. HCPT/Ce6 NPs without cellular uptake inhibitors.
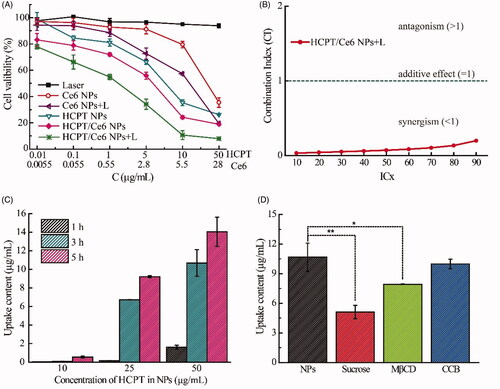
Figure 5. Representative fluorescent microcopy images of 4T1 cells incubated with HCPT/Ce6 NPs at Ce6 concentration of 5 µg/mL for different incubated times. Scar bar: 100 µm.
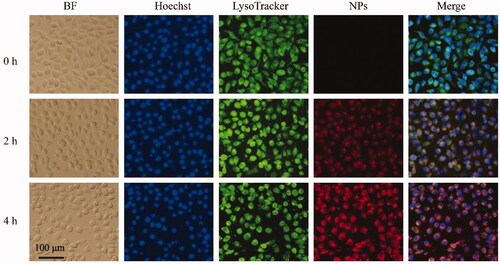
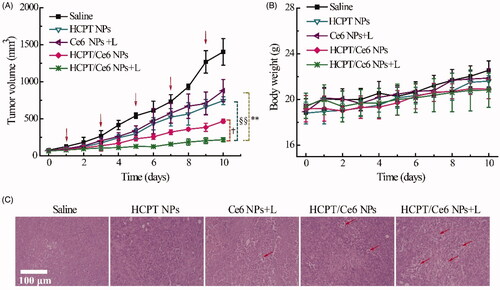
Figure 6. In vivo antitumor efficacy of HCPT/Ce6 NPs by the intravenous route: tumor volume changes (A), body weight changes (B), and HE staining of tumor (C) of 4T1 bearing BALB/c mice after treatment with different formulations. For each animal, five consecutive doses were given (marked by arrows). Data represent mean ± SD (n = 6). **p < .001 vs. Ce6 NPs + L (with laser) group, §§p < .001 vs. HCPT NPs group, and †p < .05 vs. HCPT/Ce6 NPs group (without Laser).