
Figures & data
Figure 1. Co-delivery of PTX and DHA by targeting lipid nanoemulsions for breast cancer therapy.
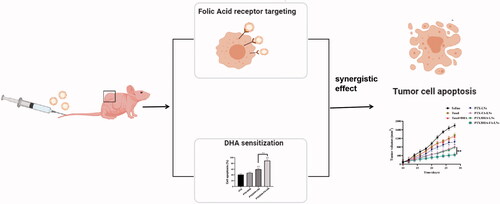
Figure 2. (A–C) Cell toxicity of PTX and DHA in different concentration ratios to MCF-7 cells. (D) The IC50 of PTX and DHA in different ratios over time. Data were represented as mean ± SD (n = 3).
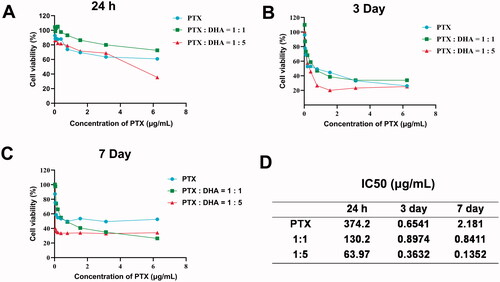
Figure 3. In vitro stability of PTX/DHA-LNs and PTX/DHA-FA-LNs. (A, B) The changes of the particle size and PDI of LNs in PBS over time. (C, D) The changes of the particle size and PDI of LNs in serum over time. Scale bar represents 200 nm.
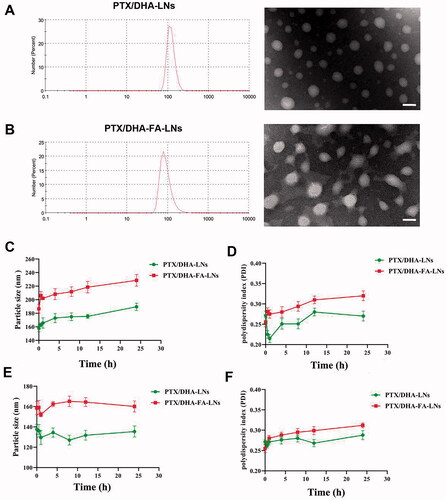
Table 1. Characterization of PTX/DHA-LNs and PTX/DHA-FA-LNs.
Figure 4. In vitro drug release profiles of PTX from PTX + DHA, PTX/DHA-LNs, and PTX/DHA-FA-LNs.
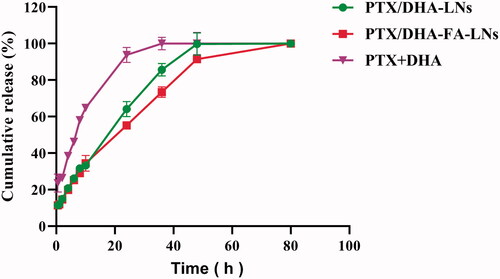
Figure 5. In vitro cell viability of PTX, PTX + DHA, PTX/DHA-LNs, and PTX/DHA-FA-LNs in MCF-7 cells after 24 h of incubation.
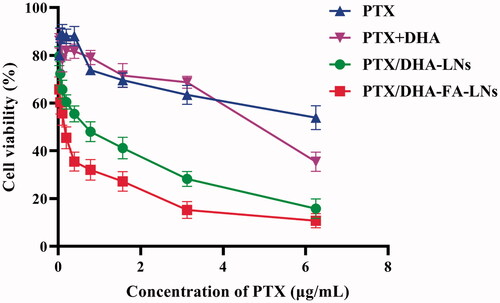
Figure 6. (B) Representative confocal laser scanning microscopy images of MCF-7 cells after incubation with PTX/DHA-FA-LNs and PTX/DHA-LNs for 0.5 h and 2 h. DAPI stains for cell nuclei (blue); DiD represents PTX (green). Scale bar represents 30 µm. (A) Cell uptake efficiency in MCF-7 was quantified by FACS analysis. Data represent means ± SD (n = 3) (**p< .01).
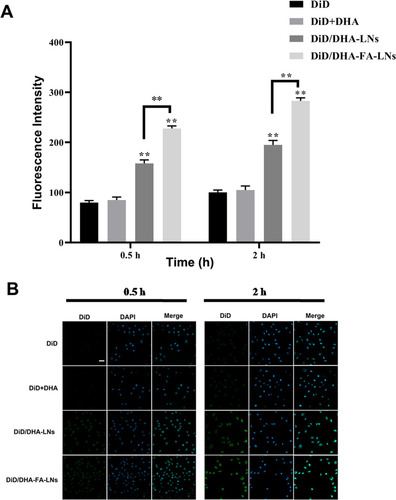
Figure 7. (A) Cell apoptosis and necrosis were analyzed by flow cytometry using annexin V-FITC in combination with PI in MCF-7 cells. (B) The quantification of apoptotic and necrotic cell percentages after treatment with different formulations in MCF-7 cells (**p< .01).
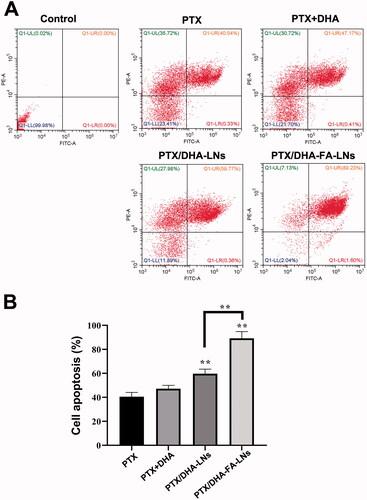
Figure 8. (B) Representative confocal laser scanning microscopy images of M2 macrophage cells after incubation with DiD/DHA-FA-LNs and DiD/DHA-LNs for 0.5 h and 2 h. DAPI stains for cell nuclei (blue); DiD represents PTX (green). Scale bar represents 30 µm. (B) Cell uptake efficiency in M2 macrophage was quantified by FACS analysis. Data represent means ± SD (n = 3) (**p< .01).
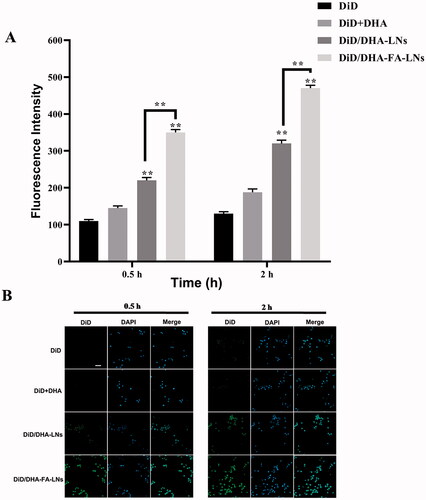
Figure 9. Confocal laser scanning microscopy images of macrophages after treatment with PBS, PTX, PTX + DHA, PTX/DHA-LNs, and PTX/DHA-FA-LNs. Cell nuclei were stained with DAPI (blue), CD86 fluorescence displayed in red and CD206 fluorescence displayed in green. Scale bar represents 20 μm. Data represent mean ± SD (n = 3).
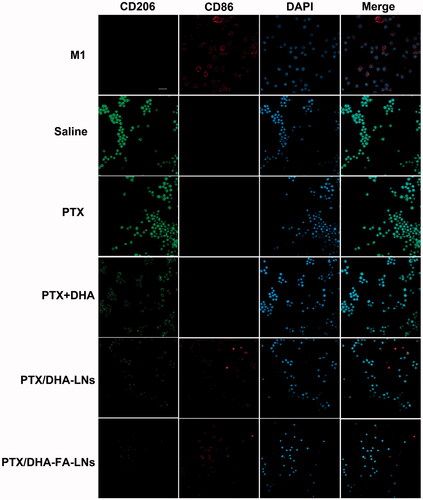
Figure 10. (A) In vivo therapeutic efficiency of a single-dose intravenous injection of different formulations to inhibit tumor growth in BALB/c mice bearing MCF-7 tumors (n = 3). (B) Average tumor volumes after treatment over the investigative period (n = 3). (C) The survival rate of mice in each group (**p< .01).
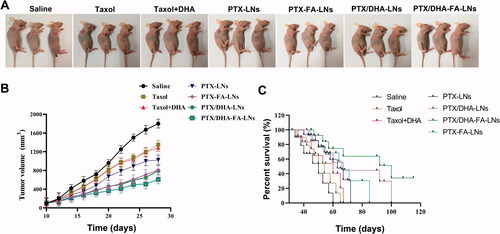
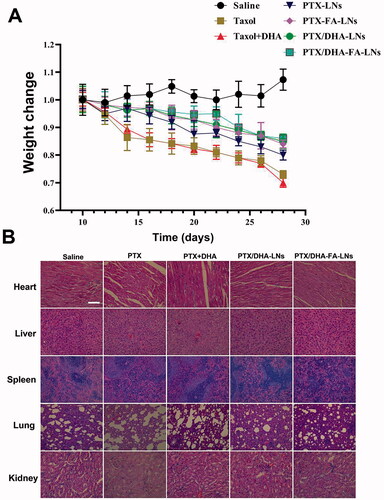
Figure 11. (A) Weight monitoring following a single-dose intravenous injection of different formulations to mice bearing MCF-7 tumor over time. (B) Morphology of different formulations groups. Tissues were isolated and stained with hematoxylin and eosin (H&E) for histopathological analysis. Scale bar represents 100 μm. Data represent means ± SD (n = 3).
Supplemental Material
Download MS Word (545 KB)Data availability statement
The raw data cannot be shared at this time as the data also forms part of an ongoing study.