
Figures & data
Table 1. Composition and characterization of GPNs formulations: yield percentage, drug content percentage, particle size, and zeta potential.
Figure 1. Chemical structure of glimepiride.
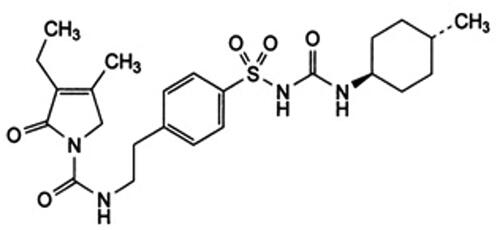
Figure 2. Powder X-ray diffraction patterns of Glimepiride, PVP K30, and GNP18 powders.
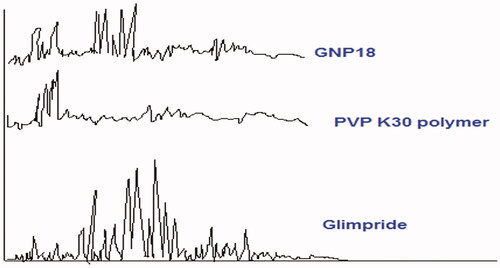
Figure 3. DSC of pure Glimepiride (A), DSC of PVP K30 polymer (B), DSC of GPN18 (C).
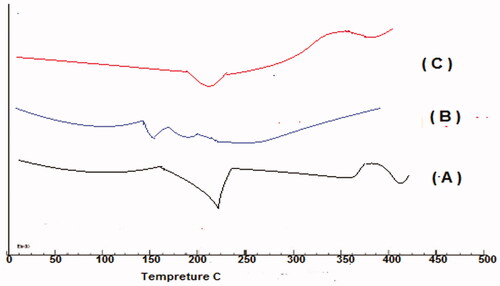
Figure 4. Contact angle of GPNS and pure glimepiride.
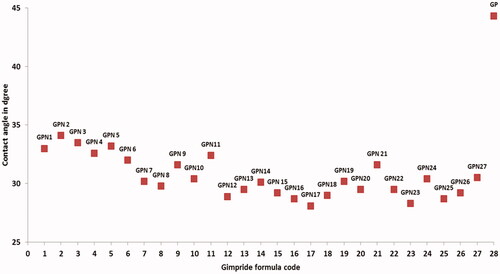
Figure 5. SEM micrographs of bulk GP (a), and selected formula of GPN particles (b).
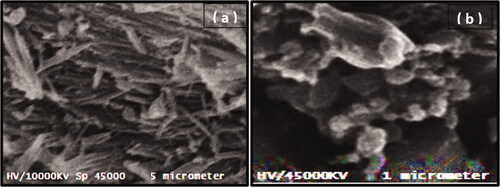
Figure 6. Saturation solubility of pure GP and GPNs formulations in water.
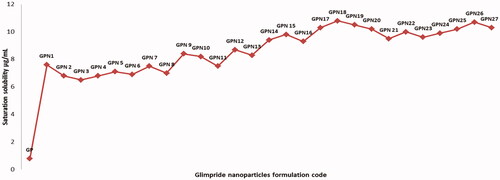
Figure 7. The cumulative percentages of drug dissolved versus time profiles of pure GP, GPN9, GPN18, and GPN27.
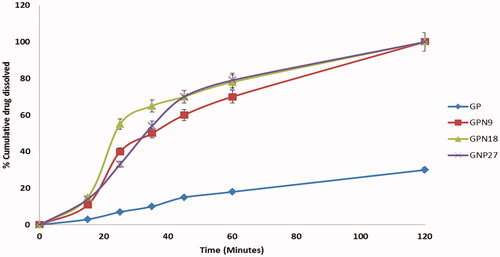
Figure 8. The antidiabetic activity of GP and GPN18 represented as a percentage of blood glucose from the initial versus time, mean ± SD.
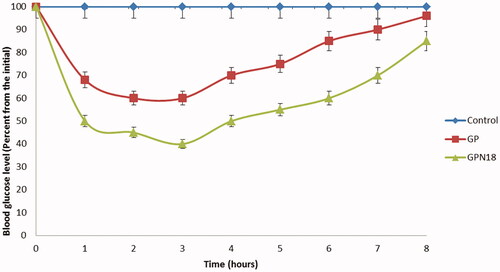
Figure 9. Plasma concentration time profiles pf GP after oral administrations of GPN18 and commercial tablets in rats (mean ± SD).
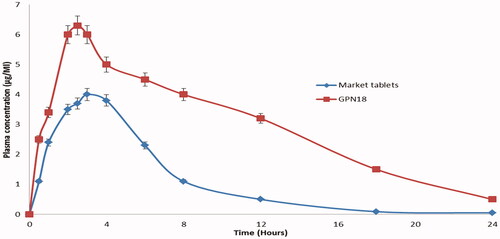
Table 2. Measured pharmacokinetics of GP following an oral administration of GPN18 and marketed tablets in rats.