
Figures & data
Table 1. Composition of the formulations of dexamethasone nanoparticles.
Table 2. Changes in nanoparticle sizes over time.
Figure 1. (A) Dispersion of dexamethasone nanoparticles and micronized dexamethasone powder in water over time. (B) Transmission electron microscopy images of micronized dexamethasone powder and dexamethasone nanoparticles. Scale bar, 500 nm
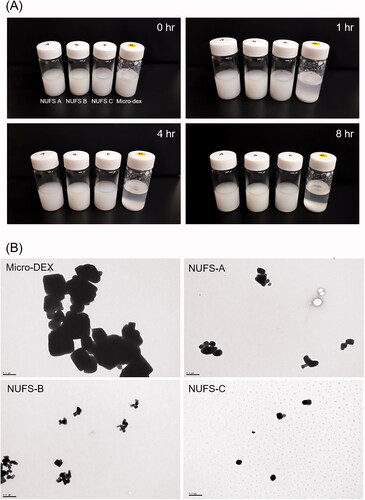
Figure 2. Dissolution profiles were drawn as the percentage of drug dissolved versus time. Dexamethasone nanoparticles (NUFS A, B, C) and micronized dexamethasone powder were dispersed in distilled water, collected over time (3, 7, 15, 30, 60, and 120 min) and detected by a high-performance liquid chromatography system. Compared to micronized dexamethasone powder, nanoparticles dissolved faster and maintained a high dissolution rate over time.
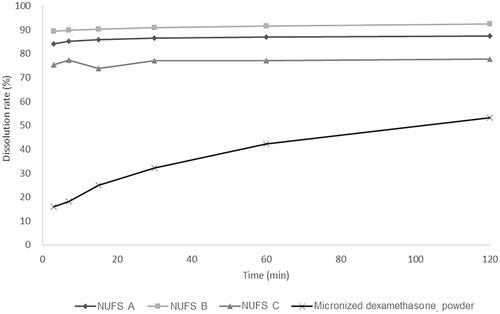
Figure 3. The cytotoxicity of the three dexamethasone nanosuspensions (NUFS) and micronized dexamethasone (micro-dex) in HEI-OC1 cells. HEI-OC1 cells were treated with NUFS A, B, C (mean particle size 382 nm, 239.3 nm, and 287.3 nm, respectively) and micro-dex (mean particle size 2357.4 nm) at various concentrations (0–100 µg/mL) for 24 hours. Cell viability was detected by a CCK-8 assay. At concentrations up to of 100 µg/mL, NUFS and micro-dex treatment for 24 h did not significantly affect cell viability. Data are the means ± SDs from three independent experiments performed in duplicate.
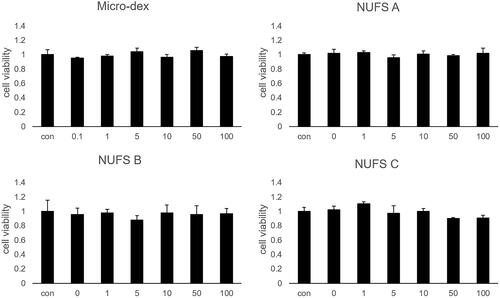
Figure 4. Comparison of dexamethasone concentrations in the perilymph after middle ear drug administration. (A) The administered concentrations of NUFS particles, micronized dexamethasone (micro-dex) particles, and dexamethasone sodium phosphate (Dex-SP) were fixed at 5 mg, and the concentrations of dexamethasone in the perilymph were compared 1, 6, and 24 h after injection into the middle ear cavity. In the test, the concentrations of each group at 1 h and 6 h were significantly different. (B) In a comparison between NUFS B and Dex-SP at different concentrations 6 h after injection, the NUFS B group showed significantly higher dexamethasone concentrations in the perilymph at all three concentrations. *p<.05 and **p<.01.
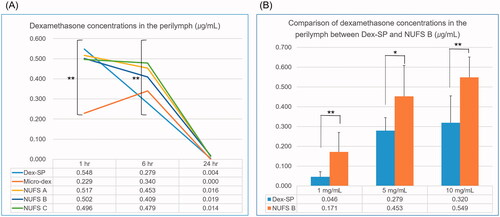
Figure 5. Intergroup comparison of the amount of dexamethasone absorbed into the cochlear tissue. (A) For an accurate comparison between animals, the amount of dexamethasone per 25 µg of protein in cochlear homogenate was quantified by LC/MS. Six hours after drug administration, the dexamethasone levels measured 36.3 ± 17.8 ng for NUFS B and 1.4 ± 1.8 ng for Dex-SP; 24 h after drug injection, the measurements were 1.6 ± 1.1 ng in the NUFS B group and 0.0 ± 0.0 ng in the Dex-SP group. (B) According to the immunochemical staining of dexamethasone in the apical turn of cochlea collected 6 h after drug administration, a higher uptake of dexamethasone was found in the NUFS B group than in the Dex-SP group. *p<.05, **p<.01, and ***p<.001.
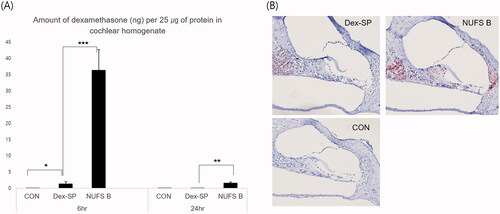
Figure 6. Comparison of drug efficacy through phosphorylation of glucocorticoid receptors. In order to predict the comparative effects of NUFS B particles and dexamethasone sodium phosphate (Dex-SP) in clinical use, glucocorticoid receptor phosphorylation was assessed through in vitro and in vivo experiments. (A) In the HEI-OC1 cell line, the phosphorylation of GR increased more in the NUFS B group than in the Dex-SP group at 1 and 6 h after treatment with 50 µg/mL Dex-SP or NUFS B. (B) In the in vivo experiment, the changes in P-GR and total GR levels in cochlear homogenates were investigated after 24 h of treatment with NUFS B and Dex-SP at concentrations of 5 mg/mL and 10 mg/mL in the middle ear cavity of BALB/c mice. P-GR levels increased more in the NUFS B group than in the Dex-SP group.
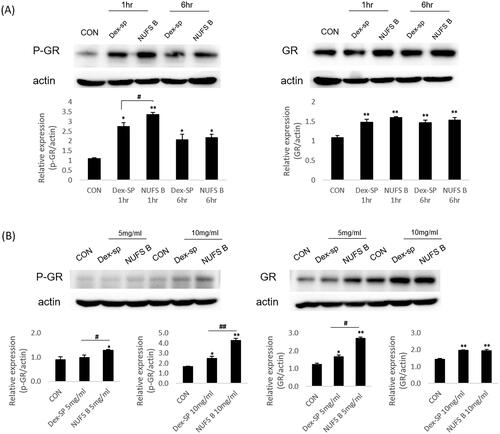
Figure 7. The therapeutic effect of NUFS B in an ototoxic animal model. (A) The auditory brainstem response (ABR) thresholds of the three groups were measured on day 14 after induction of deafness. Only the 10 mg/mL NUFS B group exhibited significantly better hearing than the other two groups at 8 and 16 kHz and the click sound. The statistical results are shown in the text. The data represent the mean ± SD from three independent experiments performed in duplicate. *p<.05, **p<.01, and ***p<.001. (B) We observed the whole organ of Corti using confocal microscopy, focusing on four specific areas of the place-frequency map. The stereocilia of the deaf-sham group and the Dex-SP group were highly damaged at all frequency areas, whereas those of NUFS B group showed less damage than those of the other two groups.
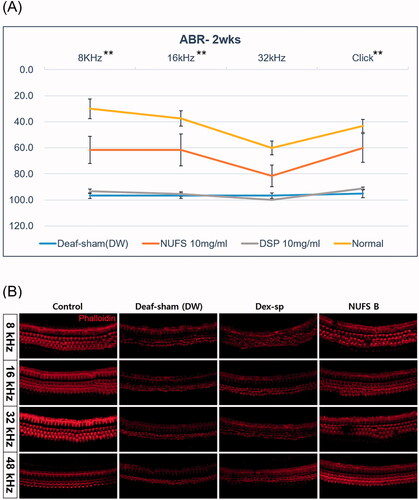
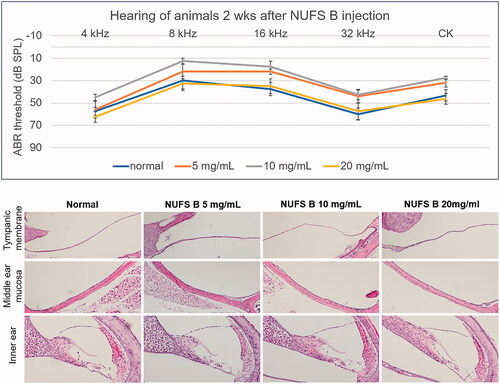
Figure 8. In vivo safety assessment after intratympanic injection of a dexamethasone nanosuspension (NUFS B). NUFS B was injected into the middle ear at concentrations of 5, 10, and 20 mg/mL. Two weeks after drug injection, the animals' hearing was evaluated by measuring the ABR, and histological evaluation was performed after the hearing examination. (A) As indicated by the ABR results, animals treated with NUFS B at up to 20 mg/mL showed no hearing loss compared to the normal group. (B) Histological evaluation showed no inflammatory reaction in the tympanic membrane or the middle ear mucosa in any of the NUFS B animals, and no damage was observed in the inner ear tissue.
Data availability statement
The raw/processed data required to reproduce these findings cannot be shared at this time due to technical or time limitations.