
Figures & data
Scheme 1. Illustration of the preparation of the drug delivery system DOX@SOF and the proposed model for acid-activable drug release in tumor cells.
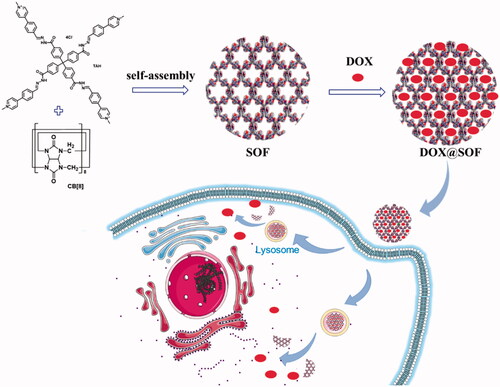
Figure 1. The structural characterization of SOF and DOX release performance of DOX@SOF. (A) SAED image of SOF; (B) small-angle X-ray scattering spectra of SOF structure in solution phase; the hydrodynamic diameter (DH) of (C) different concentrations of SOF and (D) SOF and DOX@SOF (0.2 mM) determined by DLS.
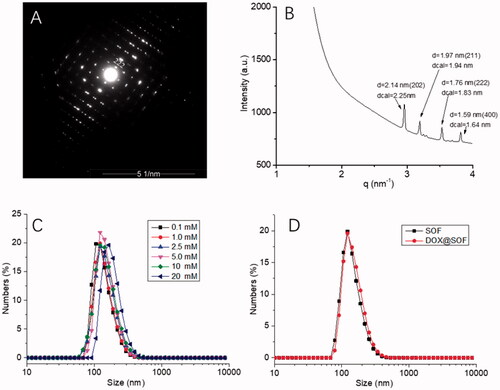
Figure 2. Release of adsorbed DOX from DOX@SOF at 37 °C against time at different pH.
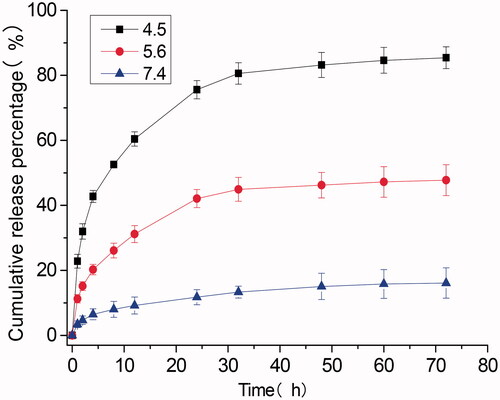
Figure 3. The therapeutic effect of DOX@SOF. Relative viabilities of MCF-7 cells treated with different concentrations of (A) SOF, (B) free DOX and DOX@SOF for 48 h. Relative viabilities of MCF-7/ADR cells treated with different concentrations of (C) SOF, (D) free DOX and DOX@SOF for 48 h (mean ± SD, n = 3).
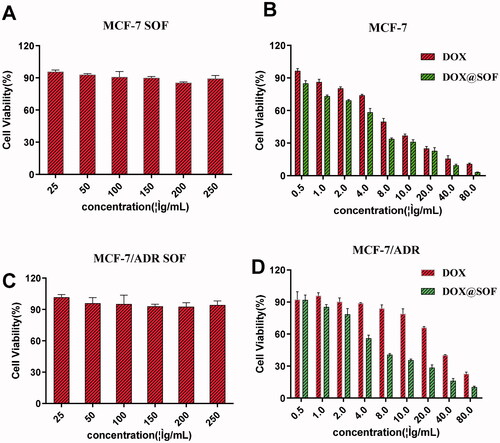
Figure 4. Apoptosis assay of the DOX@SOF in vitro. The apoptosis of MCF-7/ADR cells treated with SOF (A), free DOX (B), and DOX@SOF (C) for 48 h.
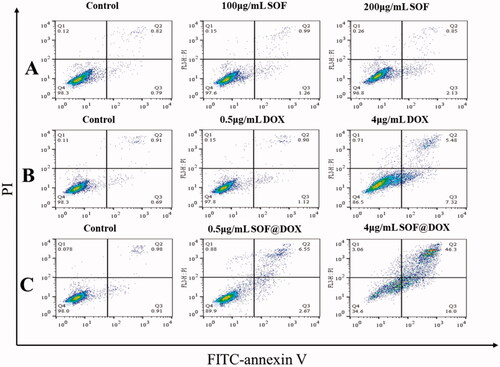
Figure 5. Cellular uptake of DOX@SOF. (A) CLSM images of MCF-7/ADR cells after 6 h incubation with DOX (a) and DOX@SOF (b). (B, C) The fluorescence intensity of MCF-7/ADR cells cultured with culture medium, SOF, and DOX@SOF (mean ± SD, n = 3; **p<.01).
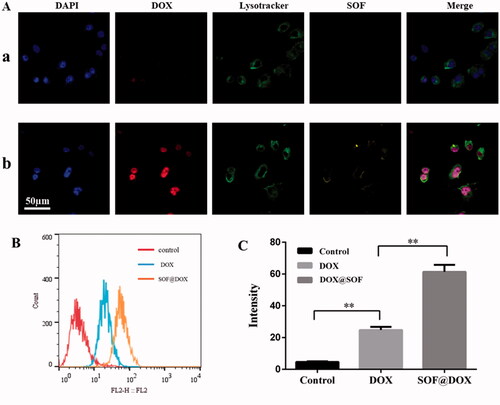
Figure 6. DOX@SOF against the tumor model of BALB/c nude mice. (A) The body weight curve (a), the tumor volume changes in different groups (b), the excised tumor tissues from all groups (c), and the tumor image in different groups (d). (B) The tumor tissue section after different treatment. The image stained by (a) HE (×200), (b) TUNEL (×200) (mean ± SD, n = 5, *p<.05, **p<.01, ***p<.001).
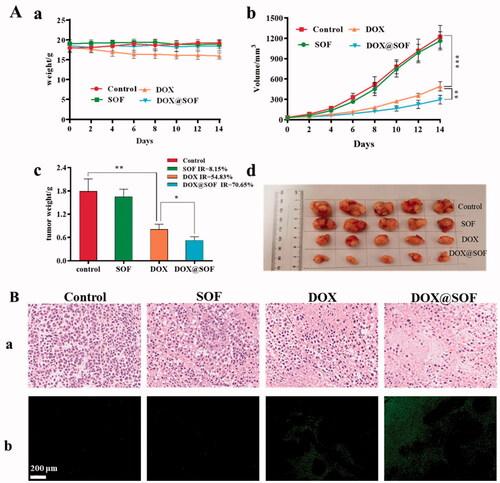
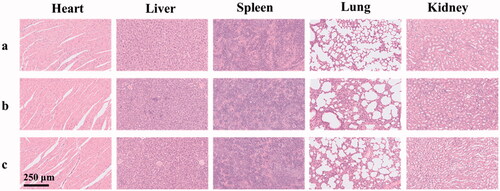
Figure 7. The histological characteristics of the main organs after treatment with glucose solution (a), SOF (b), and DOX@SOF (c) (×200).
Supplemental Material
Download MS Word (1.1 MB)Data availability statement
The data that support the findings of this study are available from the corresponding author, F. Yang, upon reasonable request.