
Figures & data
Figure 1. Characterization of SP94-PEG2000-CS, SP94-NDs, and SP94-DOX-NDs. (A) Synthetic scheme of SP94-PEG2000-CS. (B) 1HNMR spectra of SP94-PEG2000-CS. SP94: SFSIIHTPILPLGGC; CS: Chitosan. (C) Particle size of SP94-NDs. (D) TEM image of SP94-NDs. Scale bar: 500 nm. (E) TEM image of SP94-DOX-NDs. Scale bar: 500 nm. (F) Particle size of SP94-DOX-NDs. (G) Serum stability of SP94-NDs and SP94-DOX-NDs. (H) Drug release profile of SP94-DOX-NDs under US irradiation. Data are expressed as means ± SD (n = 3).
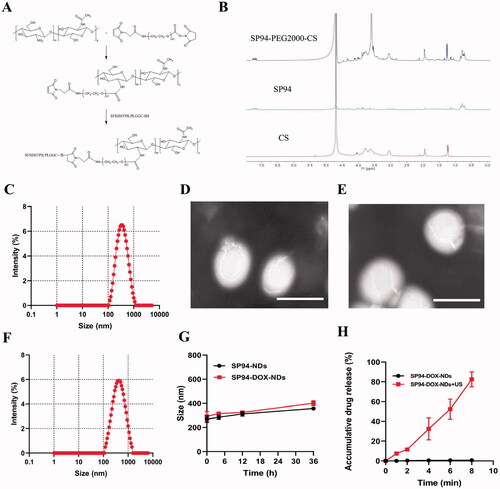
Figure 2. Biosafety and Biodistribution. (A) Cell viability comparison between different concentrations of nanodroplets. (B) Hemolytic rate at different concentrations of nanodroplets and deionized water (positive control, PC). (C) Biochemical parameters in different groups. (D) HE staining of major organs in different groups. Scale bar: 50 μm. (E) Biodistribution of SP94-DOX-NDs in nude mice at different time intervals ex vivo. (F) Quantitative analysis of average radiation efficiency in the harvested organs and tumors from (E). Data are expressed as means ± SD (n = 3).
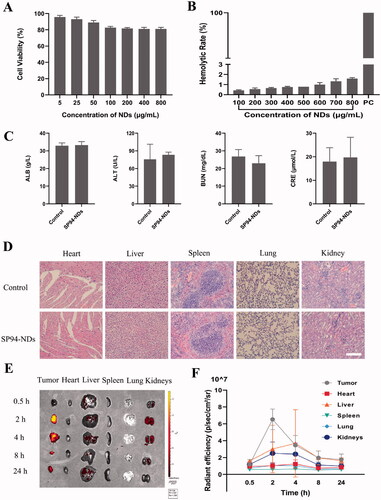
Figure 3. Targeted binding ability. (A) Fluorescence images of WPMY-1 cells and 22RV1 cells incubated with anti-GRP78 antibodies. GRP78 combined with DyLight 488-labeled IgG exhibited green fluorescence, and the nuclei labeled with DAPI staining solution exhibited blue fluorescence. Scale bar: 25 μm. (B) FCM of WPMY-1 cells and 22RV1 cells incubated with targeted SP94-NDs or non-targeted NDs. (C) Fluorescence images of WPMY-1 cells and 22RV1 cells incubated with targeted SP94-NDs or non-targeted NDs. DiI-labeled SP94-NDs and NDs are shown as red dots, while the nuclei labeled with DAPI are shown as blue dots. Scale bar: 25 μm. (D) Fluorescence images of 22RV1 cells pretreated with and without 4-PBA. Scale bar: 25 μm. (E) Quantitative histogram of the FCM result. (F) In vivo targeted ability by IVIS. (G) The average intensity of tumors from (F) (**p < .01).
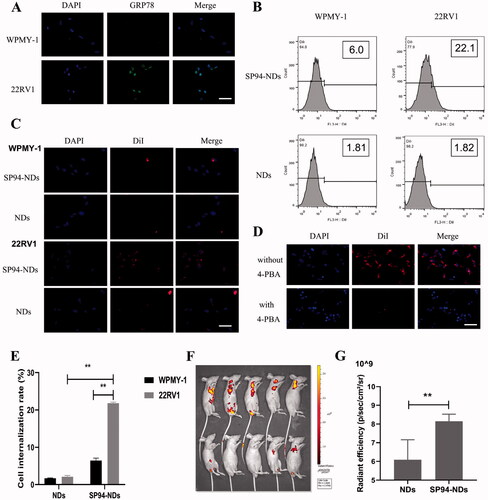
Figure 4. CEUI. (A) Ultrasound images of SP94-NDs in vitro. PBS was used as a negative control. (B) Time-intensity curve of SP94-NDs in vitro within 15 min. (C) Ultrasound images of SP94-NDs in vivo. Data are expressed as means ± SD (n = 3).
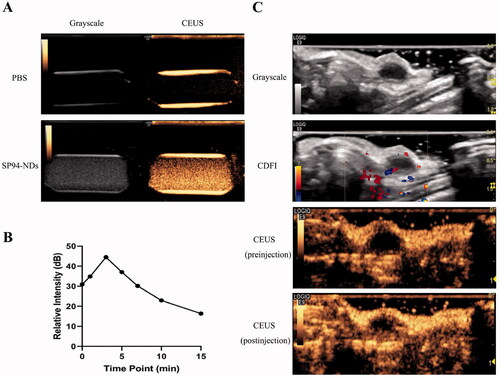
Figure 5. In vitro antitumor effect. (A) EE of DOX-loaded SP94-NDs. (B) LE of DOX-loaded SP94-NDs. (C) Cell viability comparison between various groups (**p < .01). (D) Intracellular uptake of DOX assessed by fluorescence microscopy. DOX exhibited red fluorescence, and the nuclei labeled with DAPI staining solution exhibited blue fluorescence. Scale bar: 50 μm. Data are expressed as means ± SD (n = 3).
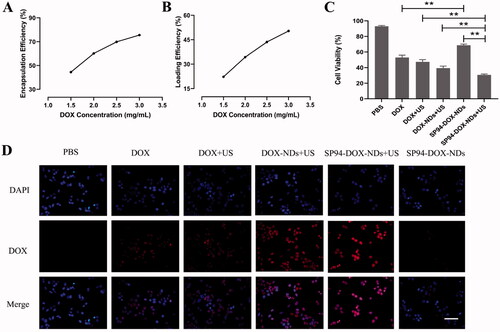
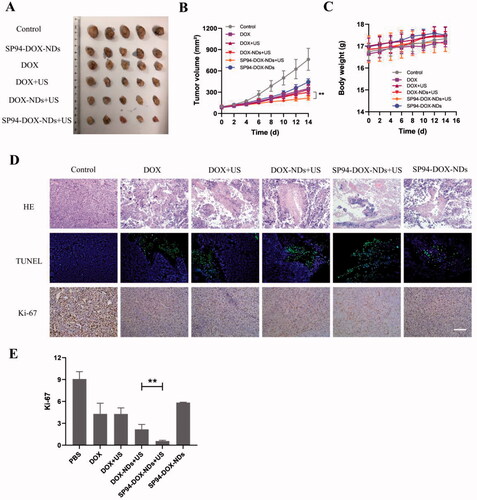
Figure 6. In vivo antitumor effect. (A) Photographs of the tumors removed from the nude mice in different treatment groups. (B) Tumor volume growth (**p < .01). (C) Body weight changes of mice. (D) HE, TUNEL, and Ki-67 staining of tumor sections after different treatments. (TUNEL positive: green) (Ki-67 positive: brown). Scale bar: 50 μm. (E) Quantification of brown areas (Ki-67 positive) using ImageJ according to the image in (D) (**p < .01). Data are expressed as means ± SD (n = 5).
Data availability statement
The data used to support the findings of this study are available from the corresponding author upon reasonable request.