
Figures & data
Table 1. The uncoded and coded levels of the NLC formulation factors were investigated using the face-centered central composite design.
Figure 1. Solubility of MZ in various lipids.
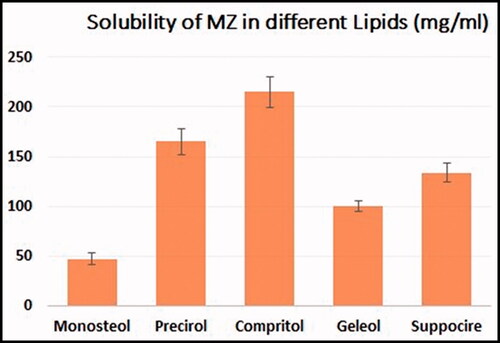
Table 2. The obtained particle size from various trials by the experimental central composite design (CCD) for the SO-based NLCs of miconazole (MZ-SO NLCs).
Table 3. Regression analysis results for selected responses (i.e. particle size, dissolution efficiency, and inhibition zone).
Figure 2. Effects of independent factors on the particle size of different prepared drug-loaded NLCs: (a) main effect plot, (b) contour plot, and (c) 3D surface plot.
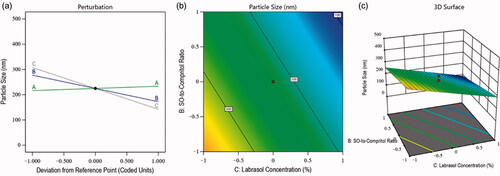
Figure 3. Effects of independent factors on the dissolution of different prepared drug-loaded NLCs: (a) main effect plot, (b) contour plot, and (c) 3D surface plot.
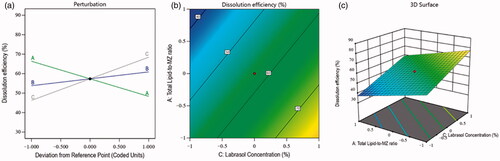
Figure 4. Effects of independent factors of different prepared drug-loaded NLCs on the inhibition zone: (a) main effect plot, (b) contour plot, and (c) 3D surface plot.
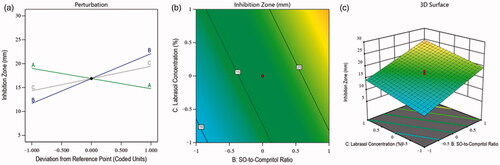
Figure 5. The desirability ramp shows the levels of the predicted and independent values for the optimized nanoformulation responses.
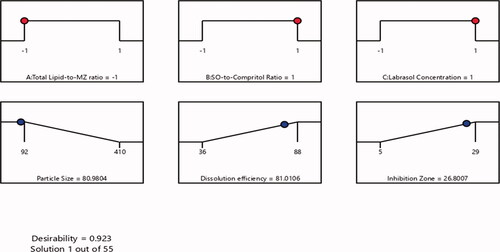
Table 4. Predicted and experimental responses of the optimized nanoformulation.
Figure 6. SEM of ultramorphological study of the optimized nanoformulation.
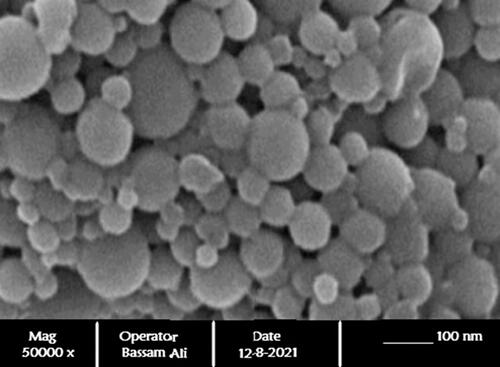
Table 5. Determined permeation parameters for MZ from different formulations (n = 3; mean ± SD).
Table 6. Ulcer index values of different animal groups (mean ± SD, n = 6).
Data availability statement
Data used to support the findings of this study are included within the article.