
Figures & data

Table 1. Formulations tested at different CS and DHO concentrations.
Table 2. Freeze-drying protocols investigated for F3 at a fixed Man: Suc of 6:2%w/v.
Table 3. CQA outcomes for optimization of cryoprotectants levels and FD procedure.
Figure 1. Lyophilizate optimization and characterization. (A) Particulate sample subjected to suboptimal FD cycle, (B) Cake collapse with prominent ridge formation and (C) Optimized FD formulation with crystalline Man scaffold, (D) DSC thermogram of F3, (E) X-ray diffractograms of (i) Man and (ii) F3, and (F) FT-IR spectra for (i) HPL, (ii) CS and (iii) F3.
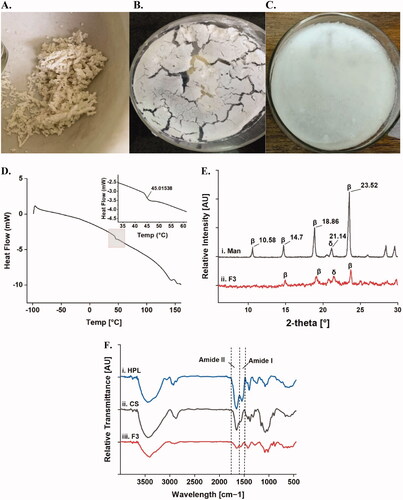
Table 4. pH and gelation time of medicated CS/DHO lyophilizates after reconstitution.
Figure 2. Representative procedure of the release experiment. (A) reconstitution of the lyophilizate and (B) The sample at the beginning (i), during (ii) and at the end (iii) of the release experiment.
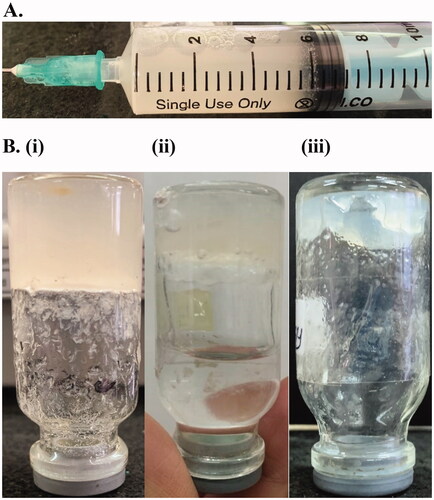
Figure 3. Total protein release profile of F1 and F2 at pH 6.5 and 7.4.
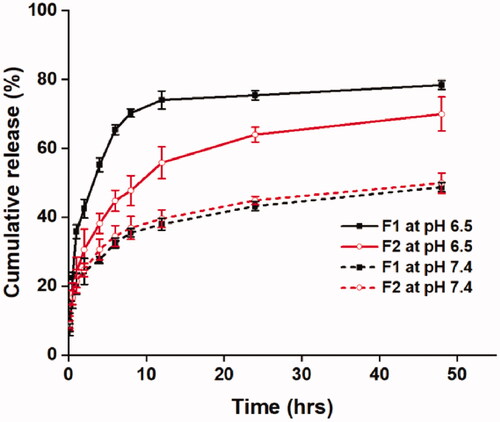
Figure 4. Release profile for Total protein. (A) F1 vs F4, (B) F2 vs. F5, (C) F3 vs. F6, and (D) PDGF-BB F1 vs F4, (E) F2 vs. F5, (F) F3 vs. F6 at a fixed DHO concentration of 1.5, 2 and 2.5%w/v, respectively.
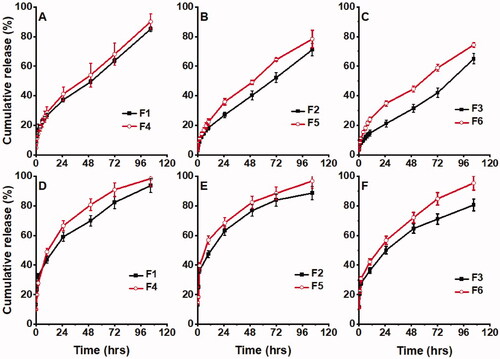
Table 5. Kinetic modeling of total protein and PDGF-BB release data.
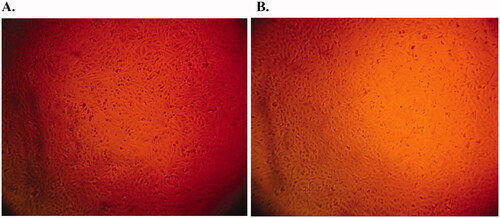
Figure 5. Cytotoxicity testing of F3. Photomicrograph showing the viability of HSF cells cultured in direct contact with a CS/DHO gel prepared with 1.8% CS and 2% DHO at a HPL concentration of: (A) 0 μg/mL and (B) 100 μg/mL.
Data availability statement
The data that support the findings of this study are available from the corresponding author, Toaa A. Abdelrahman, upon reasonable request.