
Figures & data
Figure 1. Synthesis and characterization of HA-SeSe-COOH: (A) Synthetic route of HA-SeSe-COOH; (B) 1H-NMR spectrum, and (C) FTIR spectrum of HA-SeSe-COOH.
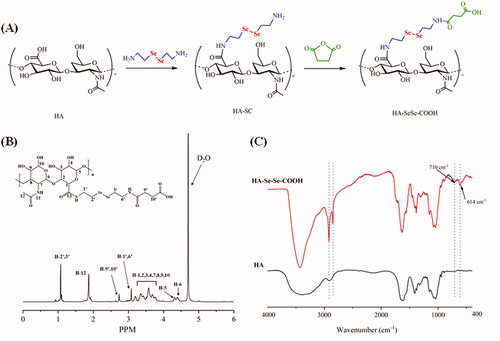
Figure 2. (A) Gel electrophoresis assay of siR-93C@PAMAM nanocomplex at different N/P ratios. (B) Zeta potentials of HA-SeSe-COOH/siR-93C@PAMAM with different mass ratios of HA-SeSe-COOH to siR-93C@PAMAM. (C) TEM image of HA-SeSe-COOH/siR-93C@PAMAM (with the ratio of 3/1). (D) Particle size of HA-SeSe-COOH/siR-93C@PAMAM under different GSH and ROS conditions.
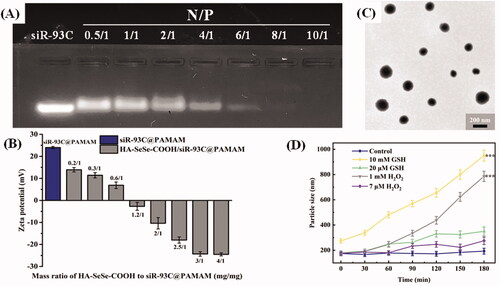
Table 1. Particle size and PDI of HA-SeSe-COOH/siR-93C@PAMAM with different mass ratios of HA-SeSe-COOH to siR-93C@PAMAM.
Figure 3. (A) Cytotoxicity of various concentrations of siNC@PAMAM and HA-SeSe-COOH/siNC@PAMAM in A549 cells from 10 to 200 nM. (B) Effect of different endocytosis inhibitors on the cellular uptake of HA-SeSe-COOH/siR-93C@PAMAM. (C) Lysosomal escape ability of siR-93C@Lipo2000, siR-93C@PAMAM and HA-SeSe-COOH/siR-93C@PAMAM against A549 cells, the blue fluorescence signal represents cell nucleus, red fluorescence represents the stained lysosome, and green fluorescence signal represents siR-93C which was labeled by FAM (*p < 0.05, **p < 0.01, ***p < 0.001, scale bar: 100 μm).
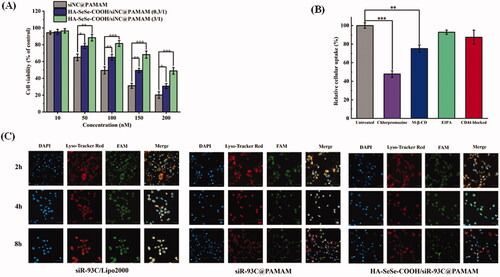
Figure 4. (A) Transfection efficiency of different concentrations of siR-93C@PAMAM and HA-SeSe-COOH/siR-93C@PAMAM from 10 to 100 nM. (B) Wound healing assay. Scale bar: 200 μm. (C) Wound scratch change of different complex (***p < 0.001, ****p < 0.0001). (D) Transwell migration assay. Scale bar: 20 μm. (E) Transwell migration analysis (*p < 0.05, **p < 0.01, ***p < 0.001).
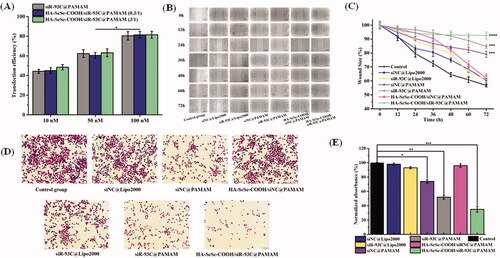
Figure 5. (A) Histograms of cell cycle distribution after the treatment with control, siR-93C@Lipo2000, siR-93C@PAMAM, and HA-SeSe-COOH/siR-93C@PAMAM. (B) Relative distribution of cell population in the cell cycle phase. (C) Cell apoptosis and (D) Cell apoptosis rate of A549 cells after the treatment with control, siR-93C@Lipo2000, siR-93C@PAMAM, and HA-SeSe-COOH/siR-93C@PAMAM. (E) Western blotting analysis. (F) Semi-quantitative western blot analysis for the expression level of KRAS.
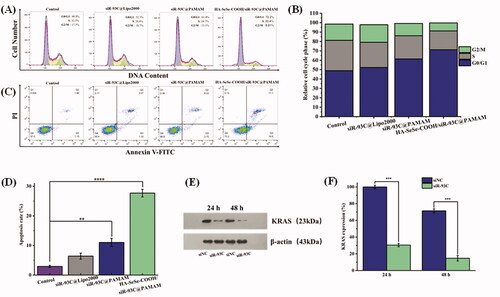
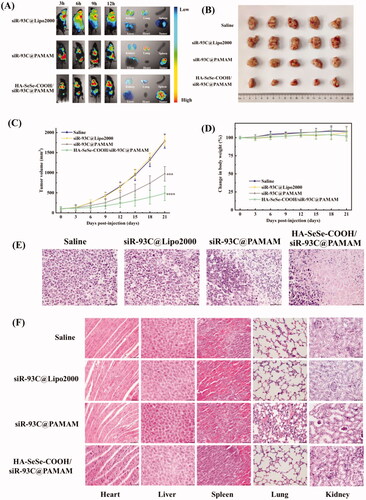
Figure 6. (A) In vivo distribution and imaging of siR-93C@Lipo2000, siR-93C@PAMAM and HA-SeSe-COOH/siR-93C@PAMAM in tumors-bearing nude mice and major organs. (B) Photograph of tumors dissected from each group at 21st day. (C) Tumor volume (mm3) of different groups. (D) Body weight changes of different treated groups. (E) Histological changes of tumor tissues after administration at 21st day (scale bar: 50 μm). (F) Histological H&E staining of major organs (heart, liver, spleen, lung and kidney) after treatment (scale bar: 50 μm).
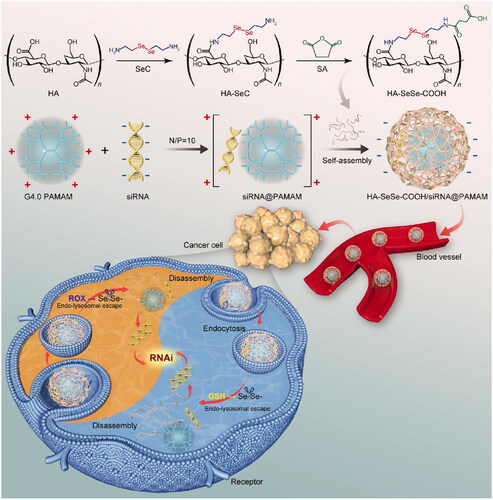
Scheme 1. Schematic illustration of the mechanism of redox-sensitive hybrid nanocomplex loading with siRNA (HA-SeSe-COOH/siR-93C@PAMAM). HA-SeSe-COOH/siR-93C@PAMAM is constructed by siR-93C@PAMAM and HA-SeSe-COOH via electrostatic assembly process. In the redox TME, diselenide bonds-modified HA begins to break down and disassemble to re-expose the PMAMA, which could promote the lysosomal escape of loaded siRNA and to further enhance transfection efficiency.
Supplemental Material
Download MS Word (1,000.3 KB)Data availability statement
All data and materials of this study can be obtained from the corresponding author upon reasonable request.