Figures & data
Figure 1. The blood concentration-time profile of free BBR. (A) Oral administration of BBR (400 mg/kg), (B) Intravenous administration of BBR (2.5 mg/kg).
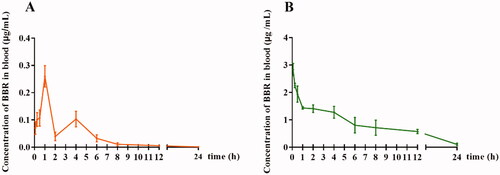
Table 1. Pharmacokinetic parameters of BBR after oral and intravenous administration in rats ( ±
) (n = 8).
Figure 2. Effects of BBR on contents of WBC, erythrocyte, PLT and Hb (n = 8). WBC: white blood cell, PLT: platelet, Hb: hemoglobin. *p < .05, **p < .01 vs Normal 5 min; #p < .05, ##p < .01 vs Normal 30 min; △p < .05, △△p < .01 vs Normal 120 min.
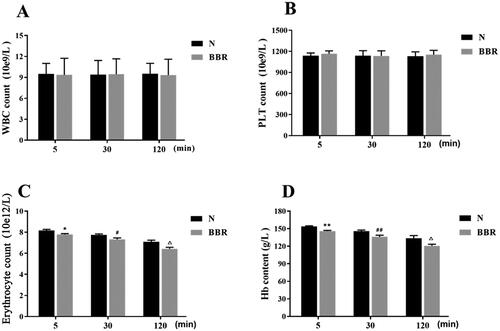
Table 2. Ce/p of BBR determined in rats following intraperitoneal injection at the dose of 2.5 mg/kg.
Figure 3. The hemolysis rate of BBR at different concentrations for 2% erythrocytes.
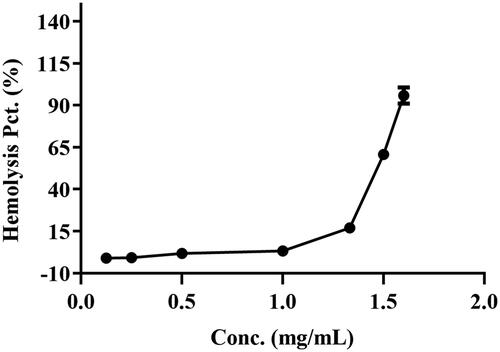
Figure 4. Effect of BBR concentration on 30% erythrocytes at 37 °C for 2 h.
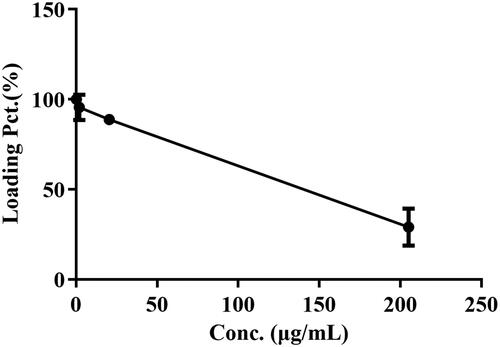
Table 3. Effect of BBR concentration on 30% erythrocytes at 37 °C for 2 h ( ±
) (n = 3).
Figure 5. Transmission electron microscopy of BBR-loaded erythrocytes by endocytosis. Control erythrocytes (A–D) were typical biconcavediscs with high electron density, and BBR-loaded erythrocytes (E–H) were close to the circular with several discrete vacuoles. Magnification was ×1,100 and ×10,400, respectively.
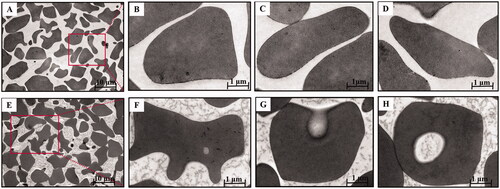
Figure 6. Stern-Volmer plots for the quenching of BHB by BBR (A) at different temperatures (corrected). Conditions: BHB: 2 × 10⁻⁶ mol/L; pH = 7.4.
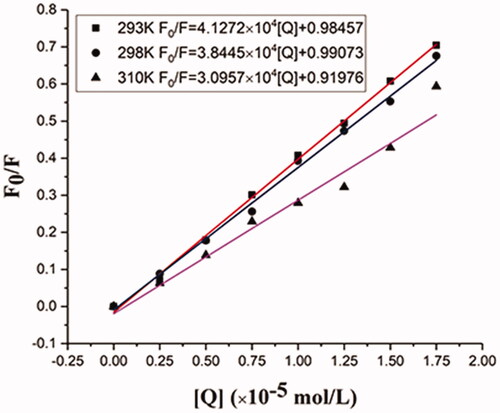
Table 4. Stern-Volmer quenching constants for the interaction of BBR with BHB at three different temperatures.
Table 5. The relative thermodynamic parameters of the BBR–BHB systems.
Figure 7. Absorption spectral titration of BHB (curve a) with increasing amounts of BBR (curves b–j). Conditions: BHB: 1 × 10⁻⁵ mol/L; BBR/(10−5 mol/L): (a) 0, (b) 0.2, (c) 0.4, (d) 0.6, (e) 0.8, (f) 1.0, (g) 1.2, (h) 1.4, (a) 1.6 and (j) 1.8. The concentration of BBR alone is 1.0 × 10⁻⁵ mol/L; pH = 7.4 and T = 298 K.
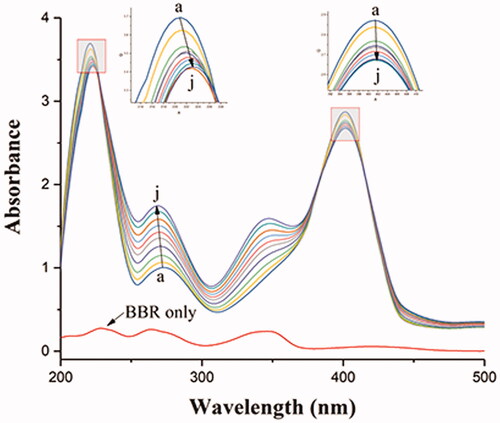
Figure 8. Synchronous fluorescence spectra of BHB with increasing amounts of BBR (curves b–g) (corrected): (A) Δλ = 15 nm; (B) Δλ = 60 nm. Conditions: BHB: 2 × 10⁻⁶ mol/L; BBR (×10−5): (a) 0, (b) 0.25, (c) 0.5, (d) 0.75, (e) 1, (f) 1.25 and (g) 1.5; pH = 7.4 and T = 298 K.
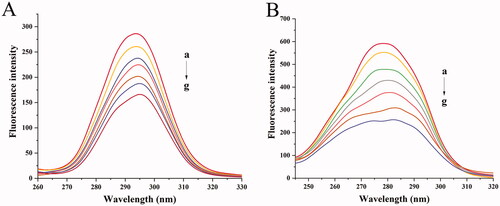
Figure 9. CD spectra of BHB and BHB-BBR systems. Conditions: BHB: 5.0 × 10⁻⁸ mol/L; (a) 0, (b) 1 × 10⁻⁷ mol/L, (c) 2 × 10⁻⁷ mol/L and (d) 4 × 10⁻⁷ mol/L; pH = 7.4 and T = 298 K.
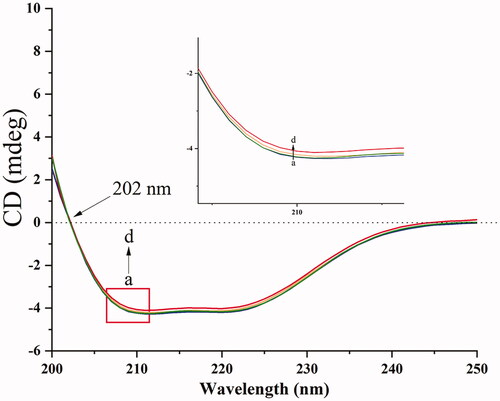
Figure 10. Raman spectrum of BHB (a) and BHB-BBR (b) system.
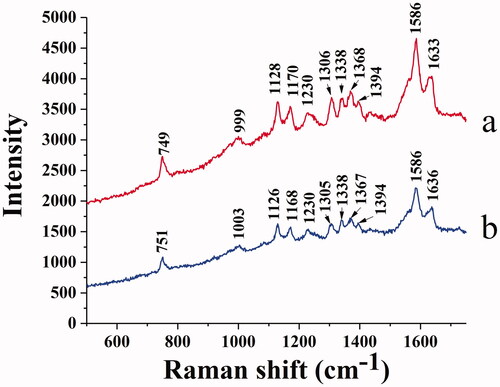
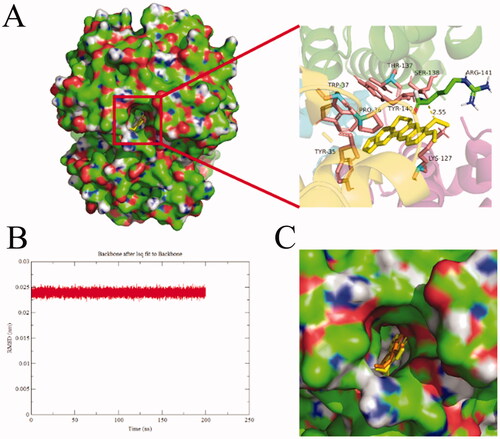
Figure 11. Docking conformations of BBR (A) in complex with BHB. (B) The rmsd value of BBR-BHB complex, (C) The protein-ligand conformation before (color: yellow) and after (color: orange) MD simulation. BBR was displayed in balls and sticks, yellow dotted lines indicated hydrogen bond (PDB ID: 1G09).