
Figures & data
Table 1. Experimental runs, independent and dependent variables of the 32 full factorials experimental design of Magnesium ascorbyl phosphate-loaded ethosomes.
Table 2. Experimental runs, independent and dependent variables of the 23 full factorials experimental design of Magnesium ascorbyl phosphate-loaded niosomes.
Figure 1. Effect of different independent factors; (X1): Ethanol concentration, (X2): PC concentration on: (a) EE%, (b) PS, (c) PDI, (d) ZP, (e) MAP % permeated (8 h) of the prepared MAP Ethosomes.
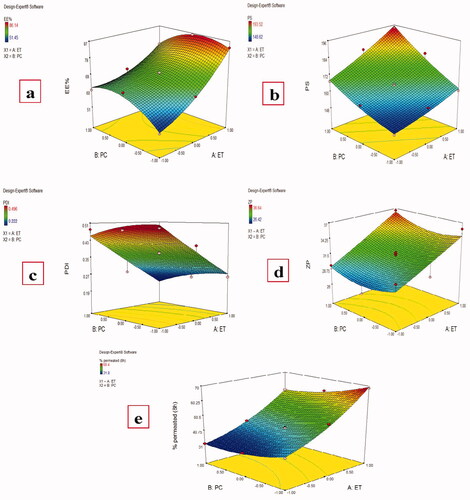
Figure 2. Effect of different independent factors; (X1): Ethanol concentration, (X2): PC concentration on: (a) EE%, (b) PS, (c) PDI, (d) ZP, (e) MAP % permeated (8 h) of the prepared MAP Niosomes.
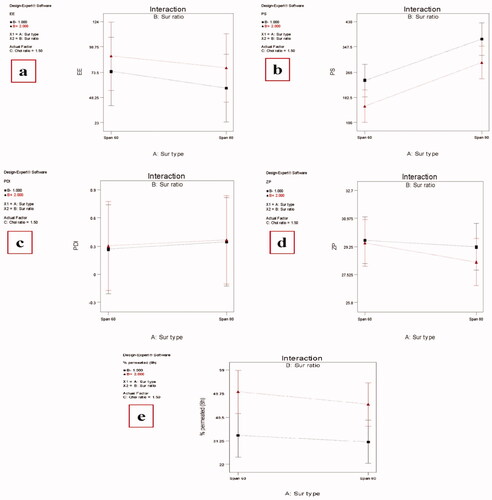
Figure 3. Transmission electron microscopy (TEM) photographs of: (a) MAP- loaded ethosomes (FE7), (b) MAP- loaded niosomes (FN3).
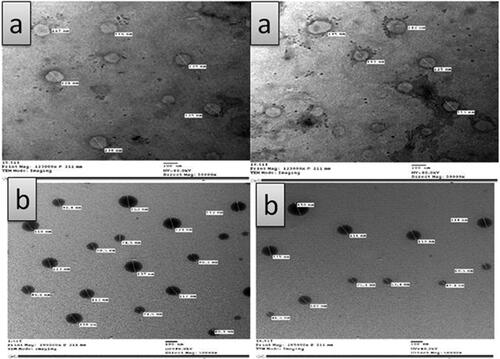
Figure 4. MAP skin permeation and skin retention from MAP solution, MAP ethosomes (FE7), MAP ethosomal (FE7) gel, MAP niosomes (FN3) and MAP niosomal (FN3) gel.
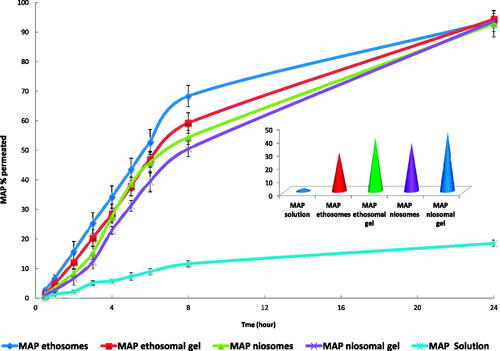
Table 3. Effect of storage on selected ethosomes (FE7) and niosomes (FN3) formulations.
Table 4. Demographic and clinical data.
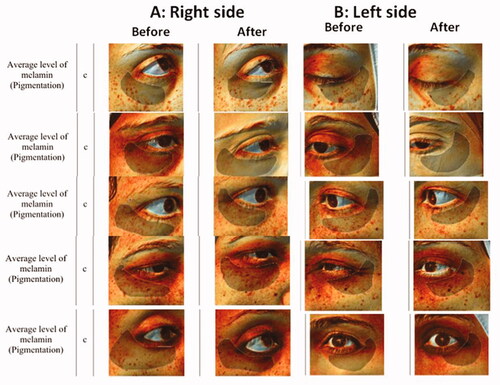
Figure 5. Samples of Antera 3D® Camera photos of before and after treatment with: (A) Right side (MAP niosoma gel) and (B) Left side (MAP ethosoal gel).
Data availability statement
The authors confirm that the data supporting the findings of this study are available within the article.