
Figures & data
Table 1. Patient characteristics (N = 46).
Figure 1. Kaplan–Meier’s curve of overall survival.
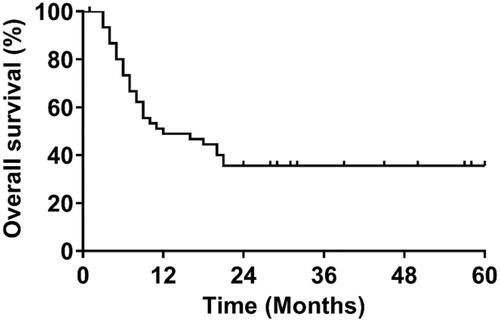
Figure 2. Physicochemical properties of nanocomplexes characterized in vitro. (A) TEM image and particle size distribution of NP-EP. The bar represents 200 μm. (B) TEM image and particle size distribution of TPP1NP-EP. The bar represents 200 μm. (C) Stabilities of NP-EP and TPP1NP-EP investigated by incubation of nanocomplexes in DMEM and the particle size changes were determined at every day in a week. (D) The release behavior of carboplatin was respectively investigated in medium of pH 6.0 and pH 7.4. (E) The release behavior of etoposide was respectively investigated in medium of pH 6.0 and pH 7.4.
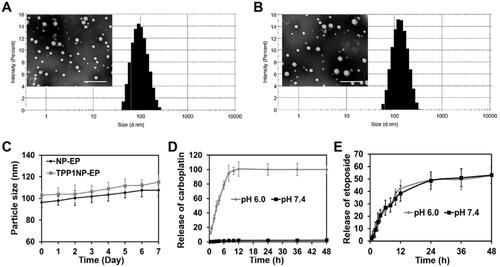
Figure 3. Cell uptake of nanocomplexes on NCI-H69 cell lines. (A) Qualitative analysis of cell uptake of nanocomplexes at different concentrations and times. The nanocomplexes were labeled with FITC for visualization. The bar represents 100 μm. (B) Quantitative analysis of cell uptake of nanocomplexes at different concentrations after incubation for 2 h. (C) Quantitative analysis of cell uptake of nanocomplexes at different concentrations after incubation for 4 h. (D) Cell uptake mechanisms investigated by incubation cells with nanocomplexes in the presence of various endocytosis inhibitors (including cyto-D, M-β-CD, NaN3, and monensin). (E) Distribution of nanocomplexes in cells was evaluated by the lysosomal co-location assay. The bar represents 50 μm.
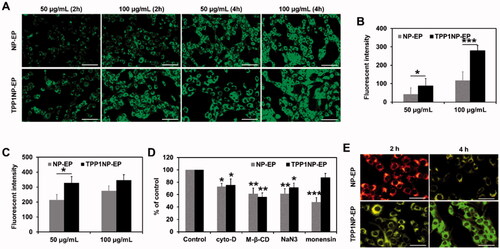
Figure 4. Anti-tumor effect of nanocomplexes in vitro evaluated on NCI-H69 cell lines. (A) Cell viability of NCI-H69 cells post treatment of NP, NP-EP, and TPP1NP-EP. The cells only incubated with medium were used as the control group. (B) Qualitative analysis of cell apoptosis induced by different nanocomplexes. The bar represents 100 μm. (C) Quantitative analysis of cell apoptosis rate induced by different nanocomplexes. (D) Lateral migration and vertical migration ability of NCI-H69 cells post different treatments determined by the wound-healing assay and trans-well assay, respectively. The bar represents 100 μm. (E) Semi-quantitative analysis of migration rate of NCI-H69 cells post different treatments. **p<.01, and ***p<.001 indicate the statistical difference versus control group.
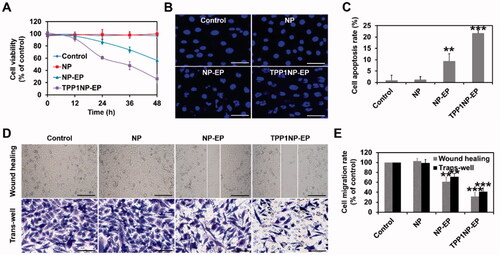
Figure 5. In vivo tumor targeting assay was performed on SCLC-bearing mice models. (A) In vivo imaging of SCLC-bearing mice after respectively injected with DiR-labeled NP-EP and TPP1NP-EP. (B) Ex vivo imaging of dissected organs (heart, liver, spleen, lung, kidney, and tumor) at 24 h post injection of nanocomplexes. (C) Semi-quantitative analysis of bio-distribution of nanocomplexes in SCLC-bearing mice models. (D) Distribution of nanocomplexes in tumor tissues with the red represents vessels stained with CD-31, the blue represents nuclei stained with DAPI, and the green represents nanocomplexes labeled with FITC. The bar represents 200 μm. ***p<.001 indicates the statistical difference versus NP-EP group.
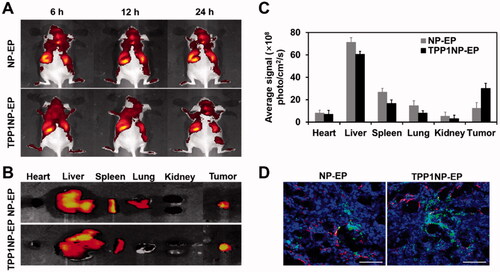
Figure 6. Anti-tumor effect of TPP1NP-EP evaluated on SCLC-bearing mice models. (A) Tumor growth after treated with blank NP, NP-EP, and TPP1NP-EP. (B) Tumor weight of mice from each group at 21 days post injection of various nanocomplexes. (C) Kaplan–Meier’s survival analysis of SCLC-bearing mice post treatment with blank NP, NP-EP, and TPP1NP-EP. (D) Relative PD-L1 expression in tumor tissues from each group after treatment of various nanocomplexes. (E) The percentages of CD4+ and CD8+ T cells in tumor tissues after treatment of various nanocomplexes. (F) Relative MHC II expression in tumor tissues after treatment of various nanocomplexes.
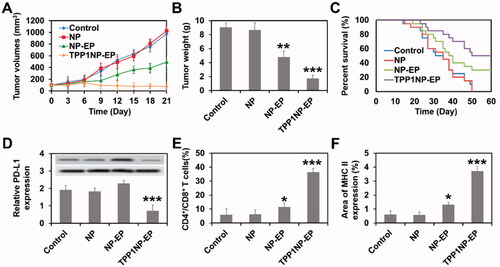
Table 2. Safety evaluation in vivo investigated by determination of multiple serum biochemical indicators after different treatments.