
Figures & data
Table 1. Compositions of nanoemulsion formulations for formation of pseudo-ternary phase diagrams.
Table 2. Compositions of TF-HCl-loaded nanoemulsions formed with olive oil (F1–F6) and clove oil (F7–F12).
Table 3. Solubility of TF-HCl to different oils, surfactants, and co-solvents (n = 3).
Figure 1. Pseudo-ternary phase diagrams for drug free nanoemulsions with Smix values of (A) 2:1, (B) 1:2 and (C) 1:1. Both the oils showed similar kind of nanoemulsion behavior. The circles presented in the figure are showing successful nanoemulsion formation area.
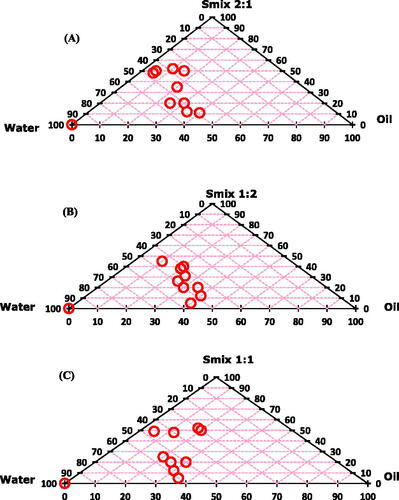
Figure 2. Size distributions by intensity of nanoemulsion formulations (A) batch F1, and (B) Batch F7.
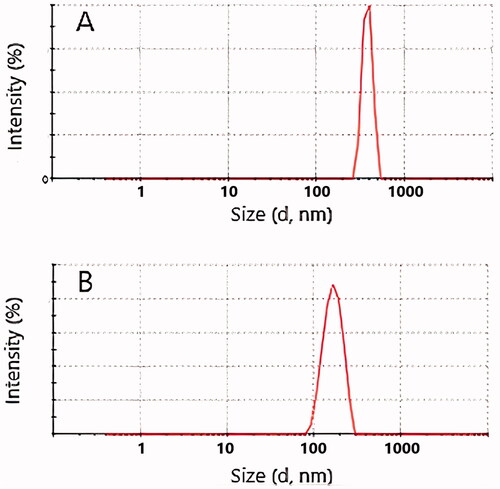
Table 4. Droplet sizes and PDI values of 5:5 oil:SMix nanoemulsions.
Figure 3. FTIR spectra from top to down: TF-HCl, olive oil, clove oil, Tween 80, ethanol, nanoemulsion F1, and nanoemulsion F7. Wavelength areas representing functional groups of TF-HCl are framed in the figure: C = C stretching (green), C–N bending (black), and aromatic alkenyl C = C–H (blue) stretching bands (Anju and Kuriachan, Citation2017). These peaks were found either unchanged or very slightly shifted in nanoemulsion spectra.
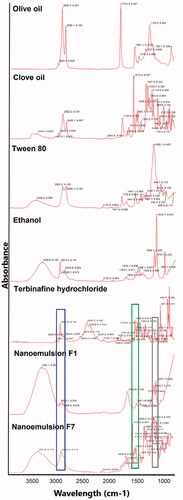
Figure 4. Zeta potential values of nanoemulsion formulations F1 and F7.
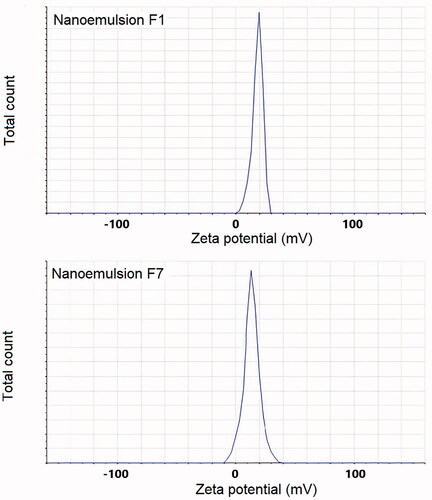
Figure 5. SEM images of nanoemulsion formulations F1 (left) and F7 (right).
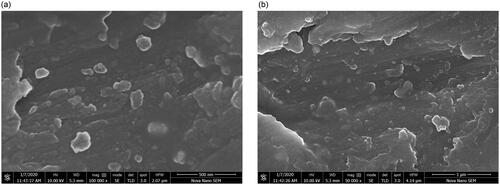
Table 5. pH, viscosity, refractive index, and entrapment efficiency values for the two optimized nanoemulsion formulations F1 and F7 (n = 3).
Table 6. Skin irritation results 24 h after the application.
Figure 6. Cumulative permeated drug as a function of time in skin permeation studies of conventional commercial cream and two optimized nanoemulsion formulations F1 and F7 (n = 3).
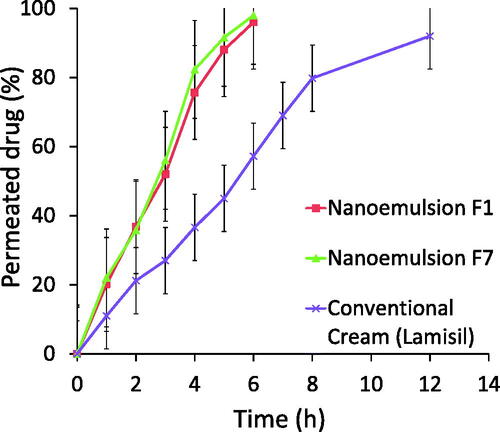
Figure 7. Drug retention studies of conventional cream and nanoemulsion formulation (F7) with time (n = 3).
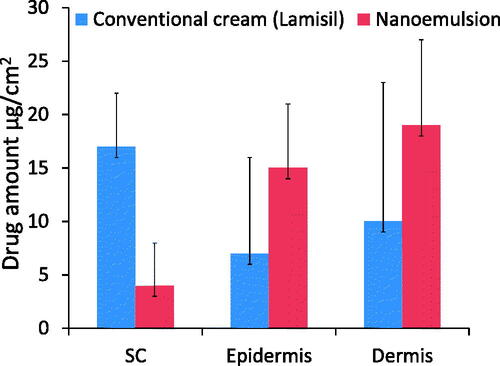
Figure 8. Photographs of skin sections of control group (Group 1), group treated with nanoemulsion F7 (Group 2), and group treated with conventional commercial cream (Lamisil) (Group 3). No signs of edema or erythema were seen (the size of shaved area is approximately 2 × 2 cm2).
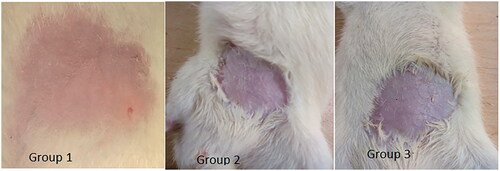
Table 7. CBC results for control group animals (Group 1), nanoemulsion F7 treated animals (Group 2), and conventional cream (Lamisil) treated animals (Group 3) (n = 3).
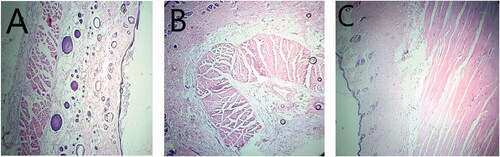
Figure 9. Skin photomicrographs (magnification 40x) of histopathological samples of (A) control Group 1 (B) nanoemulsion treated Group 2, and (C) conventional cream (Lamisil) treated Group 3.
Data availability statement
The data presented in this study are available on request from the corresponding author (Mohammad Imran Khan).