
Figures & data
Table 1. Independent variables and the correspondent values in coded and physical form.
Table 2. Solubility of SRB in solid lipids, liquid oils, surfactants, and cosurfactants (mean ± SD, n = 3).
Figure 1. Left: DSC melting curves of the different ratios of monolaurin and Capryol-90 ratios. Right: Detailed DSC thermograms of MC mixtures.
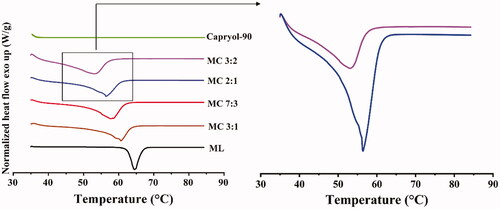
Table 3. Emulsification efficiency of CRH 40 and HS 15 (mean ± SD, n = 3).
Figure 2. Pseudo ternary phase diagrams prepared with mixed lipid (solid lipid to liquid oil is 2:1), CRH 40 (surfactant) and Transcutol®P (cosurfactant).
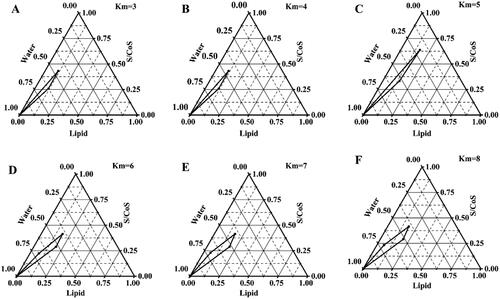
Figure 3. Actual versus predicted value.
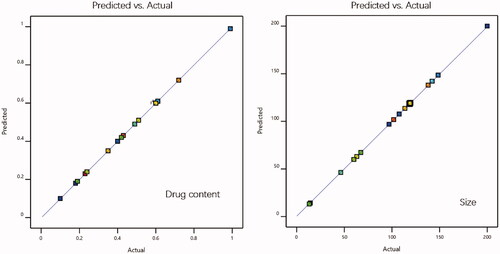
Table 4. Experimental design for SRB-NLC.
Figure 4. The TEM images of blank NLC (left) and SRB-NLC (right).
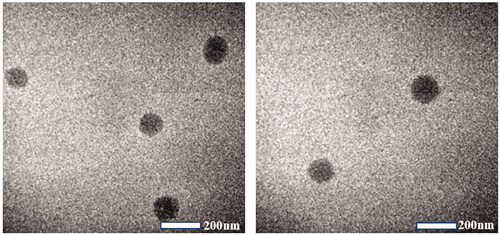
Figure 5. The particle size distribution of optimized SRB-NLC.
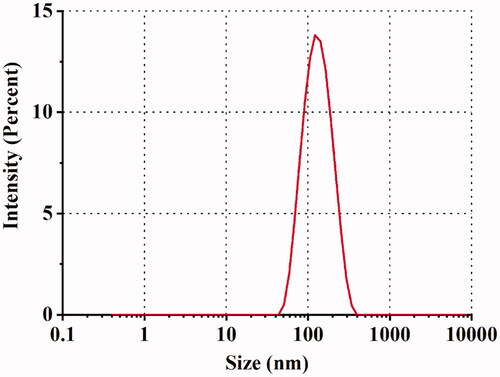
Figure 6. DSC diagrams of the SRB, SRB-NLC and Blank NLC samples.
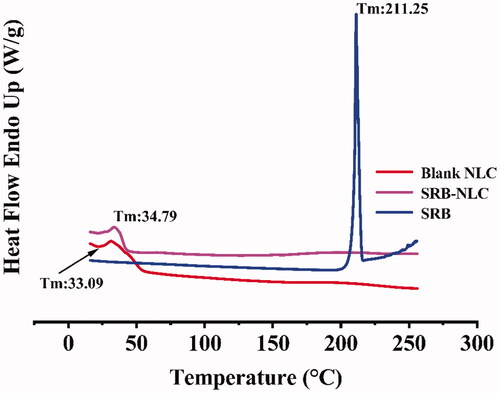
Table 5. Characterization of optimized SRB-NLC (n = 3, Mean ± SD).
Table 6. Short-term stability study of SRB-NLC (n = 3, mean ± SD).
Figure 7. Comparative drug in vitro release profile of optimized SRB-NLC and SRB-Susp. Data represented as mean ± SD, n = 3. (*P < 0.05, **P < 0.01, ***P < 0.001 vs. SRB-Susp).
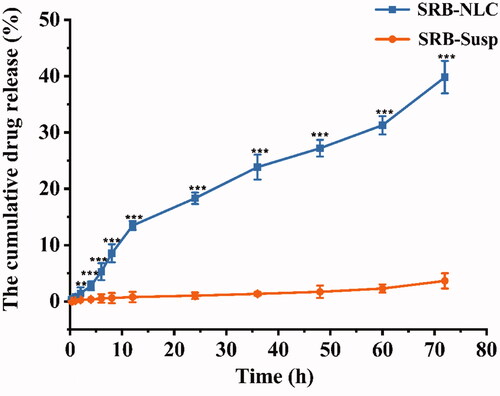
Figure 8. Results of rabbit eye irritation after single instillation of SRB-NLC (0.05%) and saline. The ocular conditions of each group were observed at different time points.
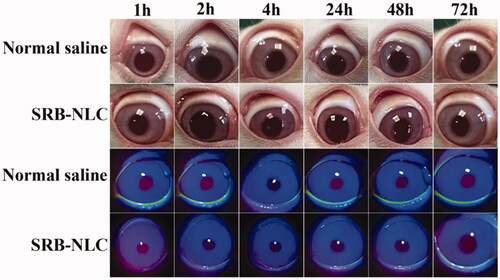
Figure 9. Results of CCK8 evaluation (n = 6). Cell viabilities of human corneal epithelial cells under (a) 0.25 h, (b) 1 h, (c) 2 h, and (d) 4 h cultivation with a series of Blank NLC and SRB-NLC solution (5 μg/mL, 10 μg/mL, 50 μg/mL, 250 μg/mL) (*P < 0.05, **P < 0.01, ***P < 0.001 vs. blank NLC).
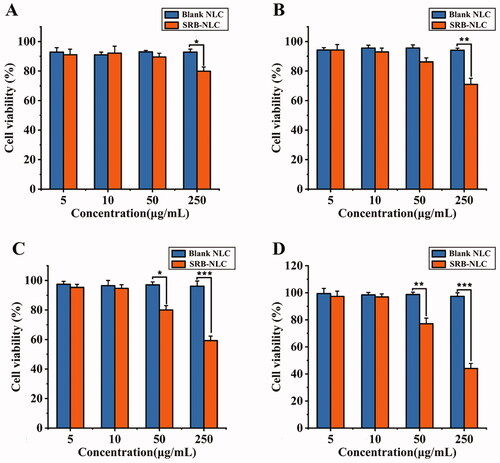
Figure 10. Concentration-time profiles of SRB in rabbit corneas (a), conjunctivas (b), and tear (c) following the single topical instillation of SRB-NLC and SRB-Susp (mean ± SD, n = 6). (*P < 0.05, **P < 0.01, ***P < 0.001 vs. SRB-Susp).
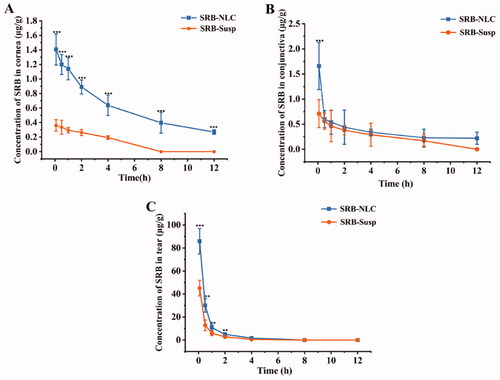
Figure 11. SRB promoted corneal epithelial recovery after treatment. (a) Representative images of the mice corneas with fluorescein staining. (b) The area of epithelial defect. (L: 0.0125% SRB-NLC, M: 0.025% SRB-NLC, H: 0.05% SRB-NLC) (*P < 0.05, **P < 0.01, ***P < 0.001 vs saline).
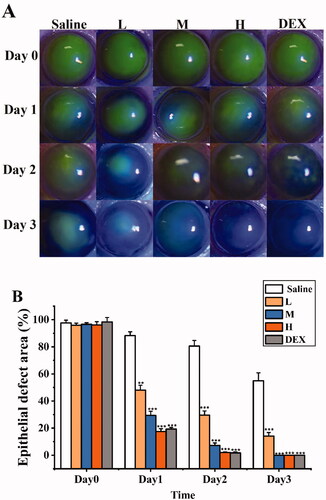
Figure 12. Inhibitory effect of SRB-NLC on corneal neovascularization (CNV). (a) Representative images of CNV on days 1, 3, and 7 after treatment. (b) Representative images of corneal flat-mounts are displayed under each group. (c) The area of CNV in the five groups at different checkpoints. The area of CNV in the high-dosage group reduced significantly compared with the control group. (L: 0.0125% SRB-NLC, M: 0.025% SRB-NLC, H:0.05% SRB-NLC) (n = 3, *P < 0.05, **P < 0.01, ***P < 0.001 vs. saline).
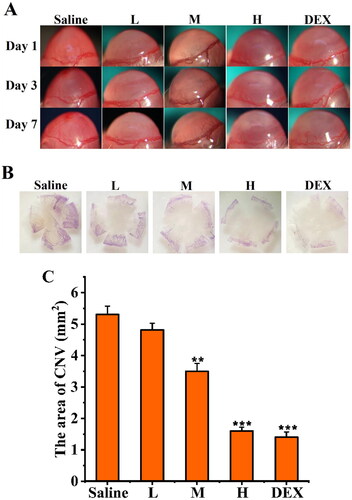
Figure 13. Histopathological examination of mice cornea. (a) Hematoxylin and eosin (HE) staining of corneal sections in the normal group (400×); (b) HE staining of corneal sections in the saline group (400 ×); (c) HE staining of corneal sections in the 0.0125% (L group) (400 ×); (d) HE staining of corneal sections in the 0.025% SRB-NLC group (M group) (400×); (e) HE staining of corneal sections in the 0.05% SRB-NLC group (H group) (400×); (f) HE staining of corneal sections in the glucocorticoid group (DEX group) (400×). The arrow indicates corneal neovascularization.
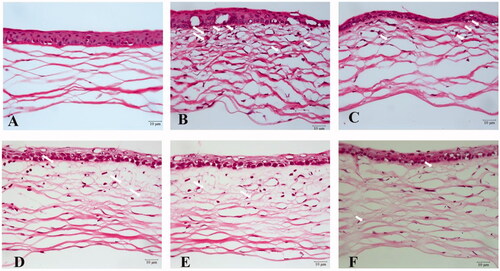
Figure 14. Protein expression in cornea on the day 3 and day 7 after treatment: the levels of VEGF-A (a) and PDGF-AB (b) were determined by Elisa in the cornea tissue respectively. (L: 0.0125% SRB-NLC, M: 0.025% SRB-NLC, H:0.05% SRB-NLC) (*P < 0.05, **P < 0.01, ***P < 0.001 vs. saline).
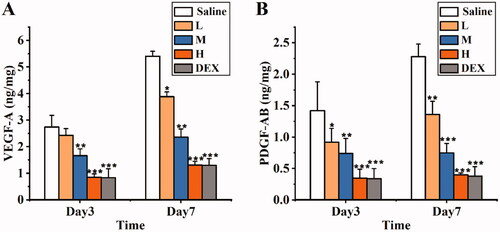
Figure 15. Three-dimensional surface plot for showing effect of the interaction of (a) Km and total lipid on drug content, (b) Km and total lipid on size.
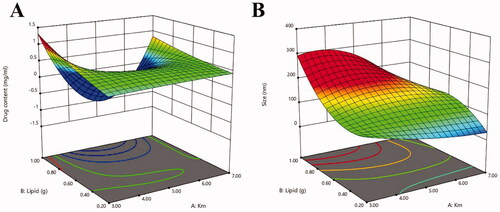
Table 7. Correlation coefficients (R2) and constant values for the different mathematical models applied to the release of SRB.
Table 8. Ocular pharmacokinetic parameters of SRB-NLC and SRB-Susp.