Figures & data
Figure 1. Images of implants using the Leica E24W microscope at ×16 magnification of (a) PEO implant, (b) 50% OLZ/PEO implant, and (c) 80% OLZ/PEO implant. Scale bar: 1 mm. SEM images of (c) PEO implant, (d) 50% OLZ/PEO implant, and (e) 80% OLZ/PEO implant at ×1000 magnification with a scale of 100 µm.
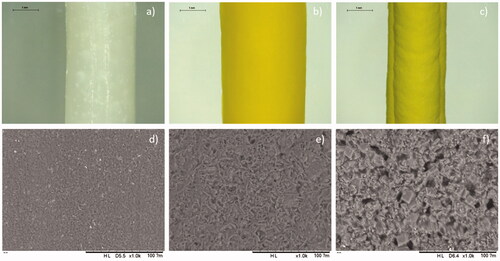
Figure 2. (a) DSC curve of OLZ powder, 80% OLZ/PEO implant, 50% OLZ/PEO implant and PEO powder, (b) TGA curve of PEO powder, 50% OLZ/PEO implant, 80% OLZ/PEO implant and OLZ powder. (c) IR spectra of OLZ powder, 80% OLZ/PEO implant, 50% OLZ/PEO implant, and PEO powder, showing % transmittance over wavenumber range 4000–600 cm−1. (d) X-ray spectra of implants with different percentages of the drug, OLZ powder and PEO powder.
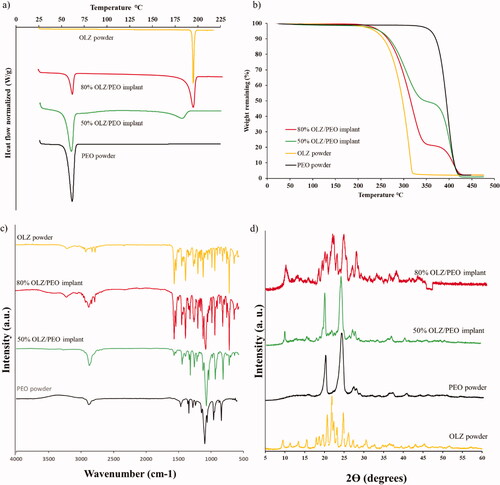
Figure 3. (a) Picture of OLZ/PEO implant without the film, (b) OCT of OLZ/PEO implant without the film, (c) image of final device, and (d) optical coherence tomography (OCT) of OLZ/PEO implant with the film. Scale bar OCT images: 1 mm.
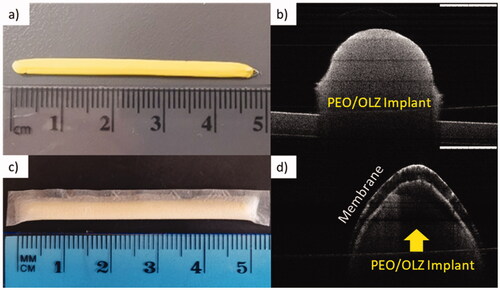
Figure 4. Graphic of (a) cumulative release implants at 50 and 80% (w/w) of OLZ in percentage, (b) cumulative release implants at 50 and 80% (w/w) of OLZ in milligrams, and (c) release in mg per day implants at 50 and 80% (w/w) of OLZ. SEM images of film at 500 magnifications, before (d) and after 190 days, (e) for the film coating implants loaded with 50% (w/w) of OLZ, and (f) for the film that coated implants loaded with 80% (w/w) of OLZ. The scale in this images is 200 µm.
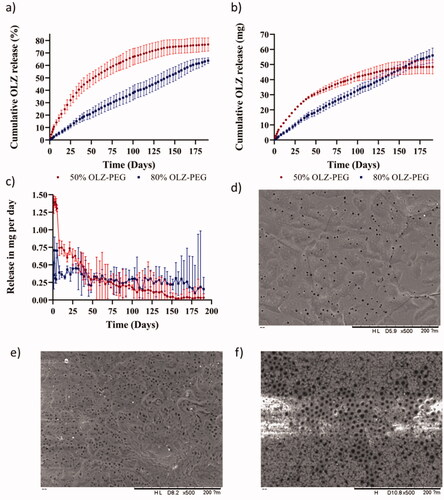
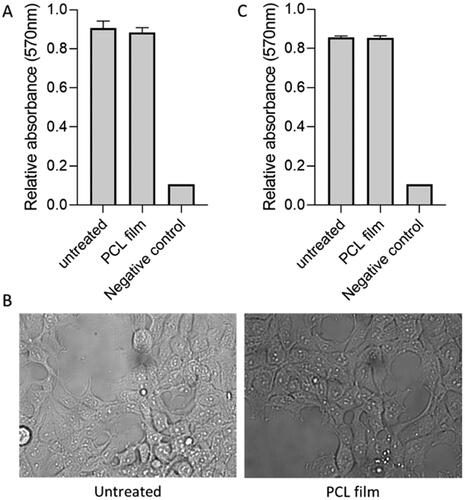
Figure 5. Cytocompatibility test for PCL-based membranes on HEK293T cells. MTT assay on day 3 post treatment (A). Microscopy images of cells on day 3 after for untreated and cells treated with PCL film (B). MTT assay on day 7 post treatment (C).