Figures & data
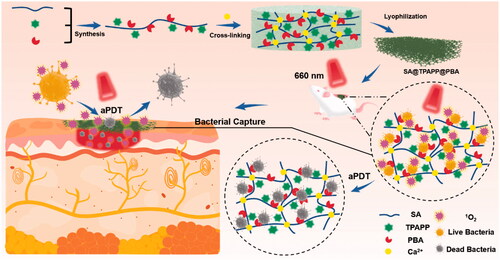
Scheme 1. Schematic illustration of alginate-based aerogel and its application as antibacterial photodynamic wound dressing.
Scheme 2. Synthesis of SA@TPAPP and SA@TPAPP@PBA molecules.
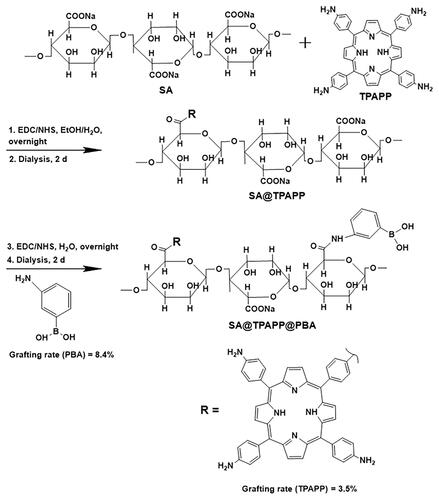
Figure 1. FTIR spectra of PBA, TPAPP, SA, SA@TPAPP, and SA@TPAPP@PBA.
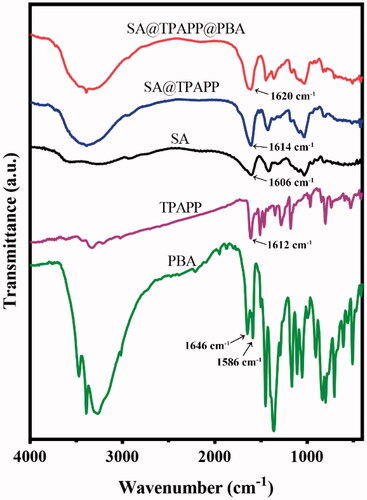
Figure 2. (a) The photographs of hydrogels and aerogels. (b) Water absorption rates and (c) porosity rates of SA, SA@TPAPP, and SA@TPAPP@PBA aerogels. (d) Morphology of gauze and aerogels. scale bar: 200 μm (top of the panel) and 50 μm (bottom of the panel).
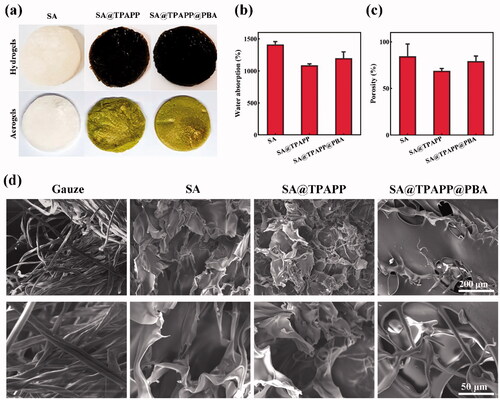
Figure 3. (a, b) UV–vis absorption spectra of DPBF treated with 660 nm laser light on/off. The curve of SA@TPAPP@PBA overlapped with that of SA and SA@TPAPP in (a).
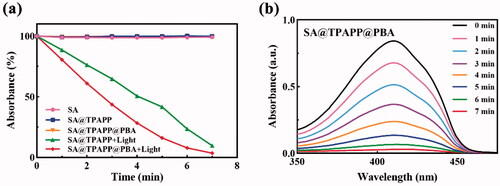
Figure 4. (a) SEM images of S. aureus adhesion on SA, SA@TPAPP, and SA@TPAPP@PBA aerogels. (b) Related histogram of S. aureus adhesion. (c) Photographs of bacterial colonies after different treatments. (d) The corresponding antibacterial rates determined by the plate counting method.
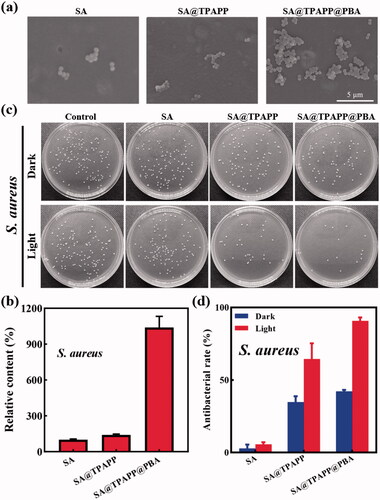
Figure 5. Confocal laser scanning microscopy (CLSM) images of S. aureus where dead/live bacteria are labeled green by SYTO 9 and dead bacteria are labeled red by PI (scale bar: 25 μm).
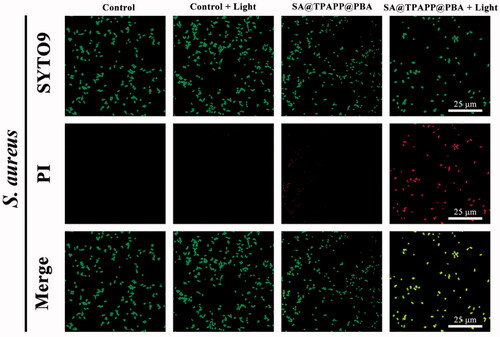
Figure 6. (a) Relative hemolysis ratio of SA, SA@TPAPP, and SA@TPAPP@PBA aerogels. Insets are the corresponding photographs. (b) Cell viability of L929 cells. (c) The images of live/dead staining of L929 cells. Scale bar: 100 μm.
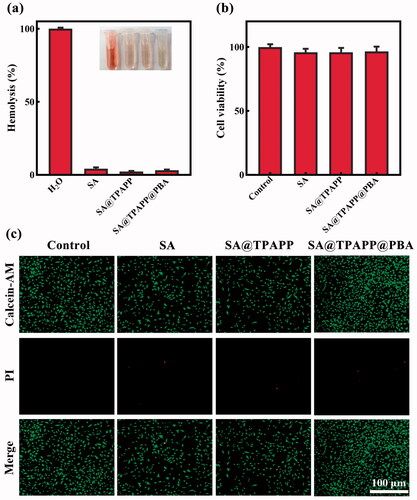
Figure 7. (a) Photographs of the hemostasis by using gauze, SA, SA@TPAPP, and SA@TPAPP@PBA aerogels. (b) Blood loss and (c) hemostatic time on the truncated rat-tail model by using gauze, SA, SA@TPAPP, and SA@TPAPP@PBA aerogels.
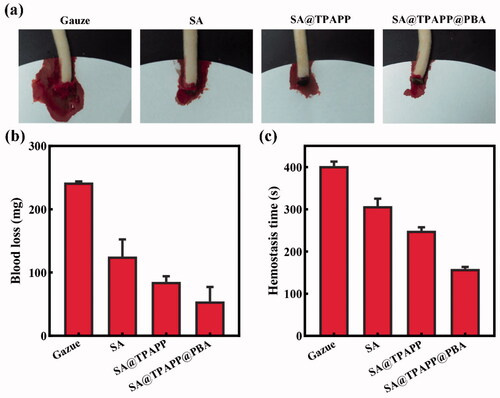
Figure 8. (a) SEM images of the blood red cells adhesion on gauze, SA, SA@TPAPP, and SA@TPAPP@PBA aerogels. (b) Related histogram of the red blood cells adhesion. (c) The blood dotting index.
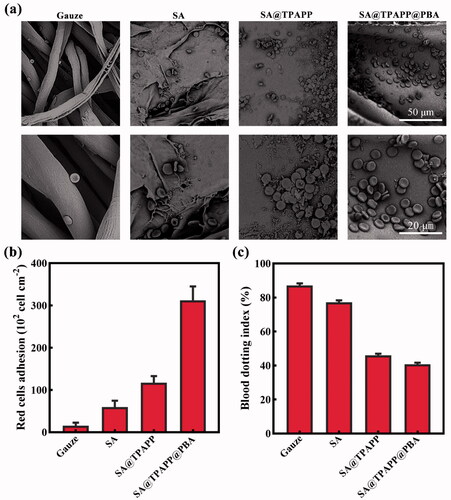
Figure 9. Photographs of the wound sites of rats after infection at 0, 7th, and 15th day.
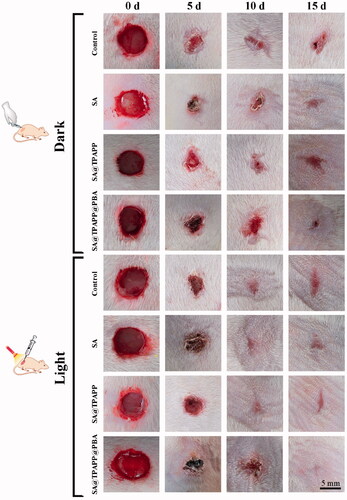
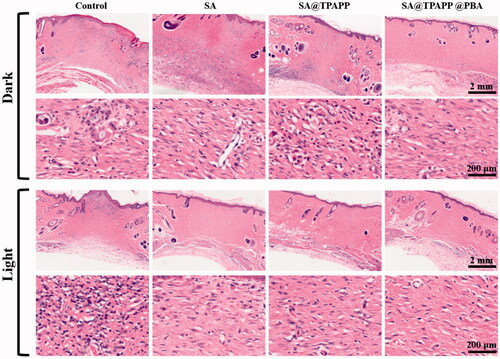
Figure 10. H&E staining of the wound section. Scale bar: 2 mm and 200 µm.