Figures & data
Table 1. Full factorial design setup showing the values of the dependent and independent factors.
Figure 1. Three-dimensional surface plot of the influence of chitosan concentration and TPP concentration on: (a) P.S of the prepared CSNPs in the absence and presence of HA and collagen, (b) PDI of the prepared CSNPs in the absence and presence of HA and collagen, (c) EE% of α-arbutin in the prepared CSNPs in absence and presence of HA and collagen.
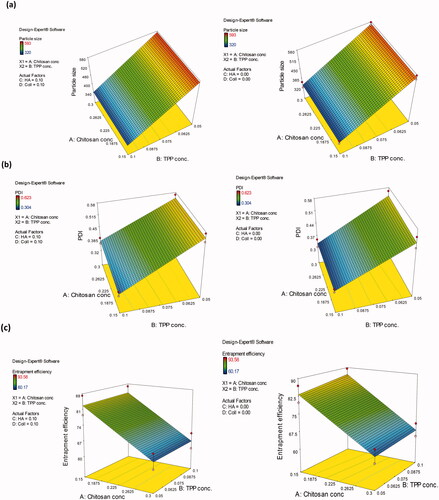
Table 2. Checkpoint analysis for P.S, PDI and EE% models for the evaluation of the adequacy of the developed models.
Table 3. Release kinetics and parameters of α-arbutin from the selected chitosan nanoparticles; dispersions and hydrogels versus their controls.
Figure 2. Release profile of α-arbutin in PBS (pH 7.4) from: (a) CSNPs dispersions compared to drug solution and (b) CSNPs hydrogels compared to the control drug hydrogel.
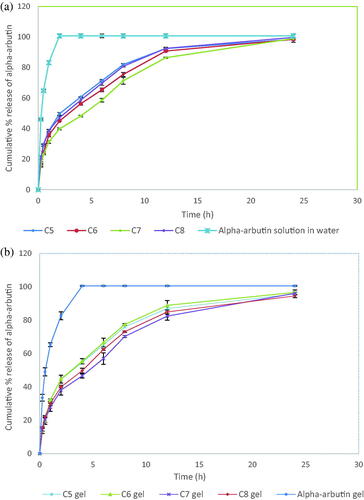
Figure 3. Percent α-arbutin ‘deposited in/permeated through’ skin layers from the selected formulations (C5–C8) as: (a) liquid dispersions compared to drug solution in PBS (pH, 7.4) and (b) gels compared to drug hydrogel control.
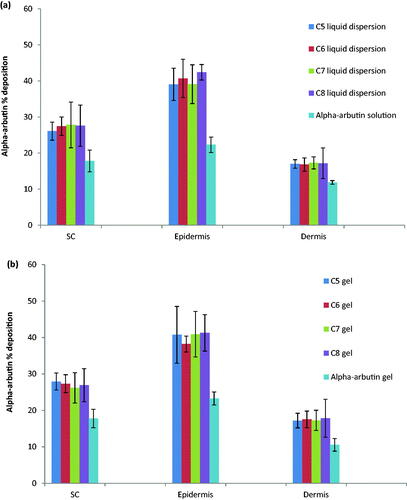
Figure 4. TEM photomicrographs of selected α-arbutin loaded CSNPs (C8) at 30000× (a), and 8000× (b).
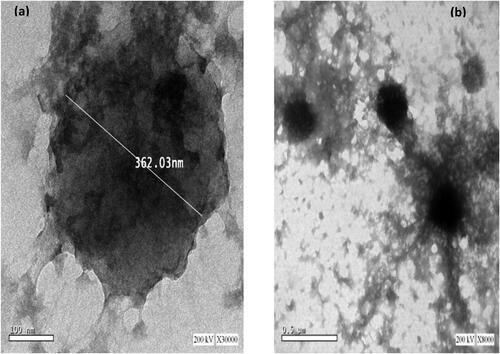
Figure 5. Two female patients with epidermal melasma: (A and C) photos for both sides of the face; right and lift, respectively before treatment showing brown spotty patches along the malar region, (B) the right side of the face after 2 months of treatment showing mild improvement in group I after topical application of C5 hydrogel (a) and good improvement in group II after topical application of C8 hydrogel (b), (D) the left side of the face after 2 months of treatment showing no improvement in both females after topical application of α-arbutin hydrogel.
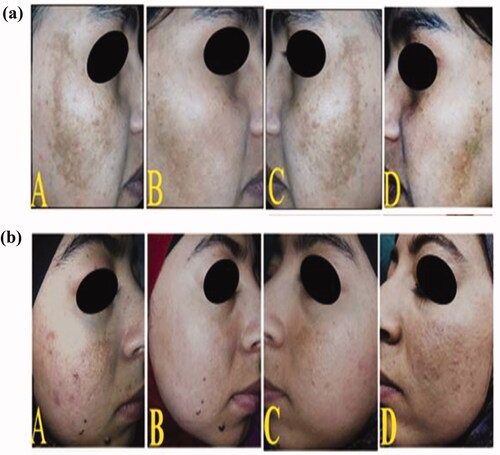
Table 4. Comparison between groups I treated with CSNPs-C5 gel and group II treated with CSNPs-C8 gel versus α-arbutin hydrogel (as control) with regards to the percent reduction of the clinical and histopathologic parameters; mMASI scores, MPSA and MART-1-positive cells number (n = 10 patients).
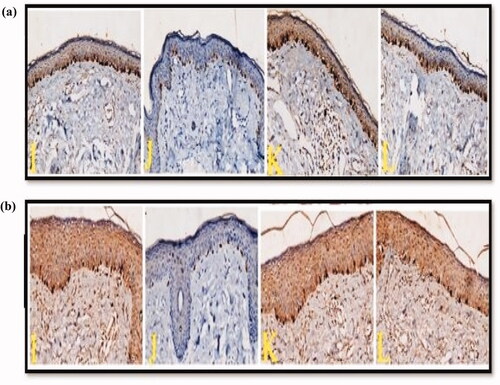
Figure 6. Two groups comprising skin biopsies from epidermal melasma lesions before and after treatment: a) Group I and b) Group II. The untreated right and left sides are denoted by E and G respectively, showing increased density of melanin in the basal layer of the epidermis. Biopsies from the right side of the face after 2 months of treatment (F) demonstrated significant decrease in epidermal MPSA in groups I and II after the application of C5 and C8 hydrogels, respectively. Biopsies from the left side of the face after 2 months of treatment (H) demonstrated insignificant decrease in epidermal MPSA in both groups after topical application of α-arbutin hydrogel (MF stain X200).
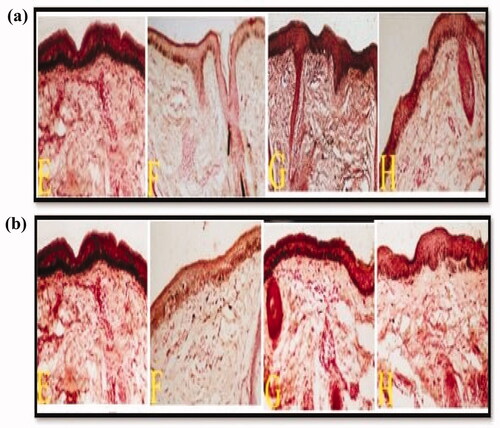
Figure 7. Two groups comprising skin biopsies from epidermal melasma lesions before and after treatment (a) Group I and (b) Group II. The untreated right and left sides are denoted by I and K respectively, showing increased number of MART-1-positive stained cells in the basal layer of the epidermis. After 2 months of treatment with the nano-formulations gels, (J) biopsies demonstrated significant decrease in the number of epidermal MART-1-positive cells in groups I and II after topical application of C5 and C8 hydrogels respectively. Biopsies from the left side of the face after 2 months of treatment with α-arbutin hydrogel (L) demonstrated insignificant decrease in the number of epidermal MART-1-positive cells in both groups (MART-1 stain X200).