
Figures & data
Figure 1. % cell viability at different levels of Cmax.
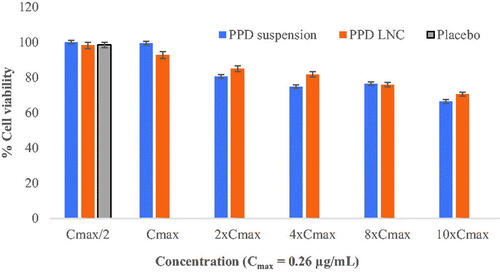
Figure 2. (A) Brain drug concentration and (B) Plasma drug concentration of PPD suspension and PPD-LNC.
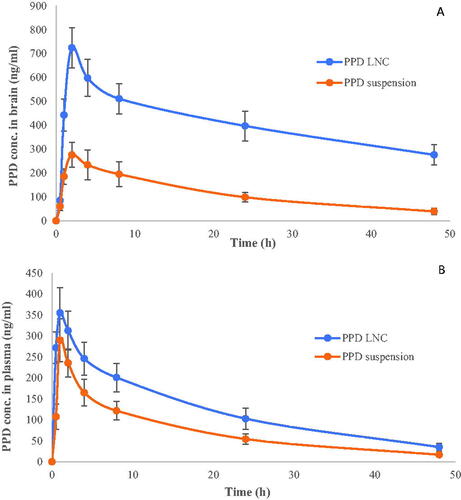
Table 1. Pharmacokinetic parameters were obtained after oral dosing of rat PPD suspension and PPD-LNC. Data expressed as mean ± SD (n = 3).
Figure 3. Mechanism of NLC-mediated drug delivery to the brain via the oral route.
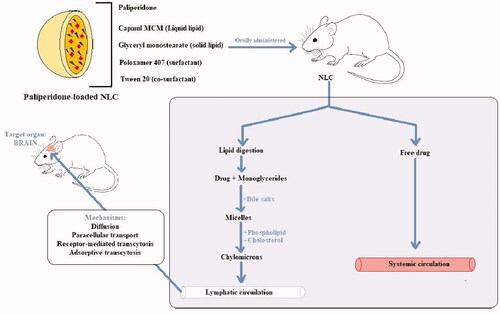
Figure 4. Effect of PPD-LNC on (A) Catalepsy in ketamine-induced schizophrenia in rats (B) Escape latency time in Morris water maze test (C) Time spent in open and closed arm in elevated plus maze model. Data are expressed as mean ± SD (n = 3).
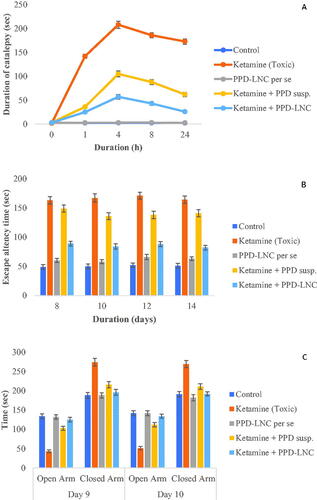
Figure 5. (A) H & E stained sections of the hippocampus in rats treated with normal saline (control), ketamine (toxic), ketamine + conventional formulation PPD suspension, ketamine + nanoformulation PPD-LNC, and PPD-LNC per se. (B) H & E stained sections of cortex in rats treated with normal saline (control), ketamine (toxic), ketamine + PPD suspension, ketamine + PPD-LNC, and PPD-LNC per se.
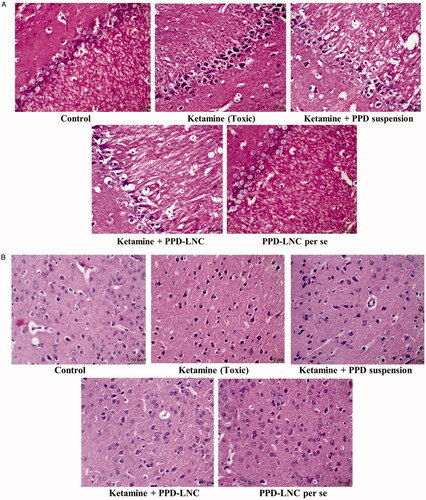
Figure 6. (A) Images showing the expression level of NF-κB in the hippocampus when rats were treated with normal saline (control), ketamine (toxic), ketamine + PPD suspension, ketamine + PPD-LNC, and PPD-LNC per se. Graphs showing the semiquantitative analysis of different treatment groups expressed as % area. The values were expressed as mean ± SEM (n = 6), and statistical analysis was performed using One Way ANOVA, Tukey’s multiple comparison test [scale bar- 50 μm]. (B) Images showing the expression level of NF-κB in the cortex when rats were treated with normal saline (control), ketamine (toxic), ketamine + PPD suspension, ketamine + PPD-LNC, and PPD-LNC per se. Graphs showing the semiquantitative analysis of different treatment groups expressed as % area. The values were expressed as mean ± SEM (n = 6), and statistical analysis was performed using One Way ANOVA, Tukey’s multiple comparison test [scale bar- 50 μm].
![Figure 6. (A) Images showing the expression level of NF-κB in the hippocampus when rats were treated with normal saline (control), ketamine (toxic), ketamine + PPD suspension, ketamine + PPD-LNC, and PPD-LNC per se. Graphs showing the semiquantitative analysis of different treatment groups expressed as % area. The values were expressed as mean ± SEM (n = 6), and statistical analysis was performed using One Way ANOVA, Tukey’s multiple comparison test [scale bar- 50 μm]. (B) Images showing the expression level of NF-κB in the cortex when rats were treated with normal saline (control), ketamine (toxic), ketamine + PPD suspension, ketamine + PPD-LNC, and PPD-LNC per se. Graphs showing the semiquantitative analysis of different treatment groups expressed as % area. The values were expressed as mean ± SEM (n = 6), and statistical analysis was performed using One Way ANOVA, Tukey’s multiple comparison test [scale bar- 50 μm].](/cms/asset/3ac2786e-37b9-44a4-a391-07c310bebb69/idrd_a_2069880_f0006_c.jpg)
Table 2. Effect of PPD-LNC on different oxidative stress markers in ketamine-induced schizophrenia in rats. Data expressed as mean ± SD (n = 3).
Table 3. Effect of PPD-LNC on neuroinflammatory markers in ketamine-induced schizophrenia in rats. Data expressed as mean ± SD (n = 3).
Table 4. Stability of PPD-LNC for three months storage at 25 ± 2 °C/60 ± 5% RH and 40 ± 2 °C/75 ± 5% RH. Data expressed as mean ± SD (n = 3).