
Figures & data
Figure 1. Chemical structure of GA (A) and TA (B).
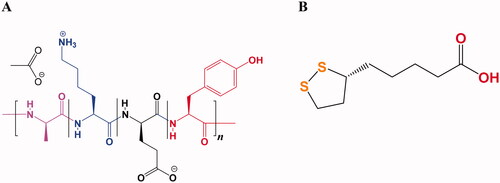
Figure 2. Thioctamer particle size as measured with the particle size analyzer.
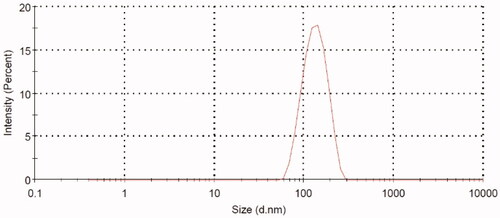
Figure 3. Zeta potential values of thioctamer (A), TA (B), and GA (C).
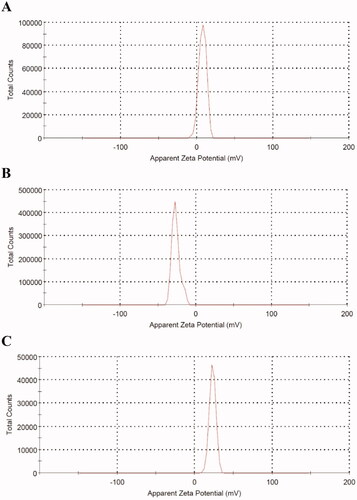
Figure 4. In vitro GA release from the thioctamer formula. Data represented as mean ± SD (n = 3).
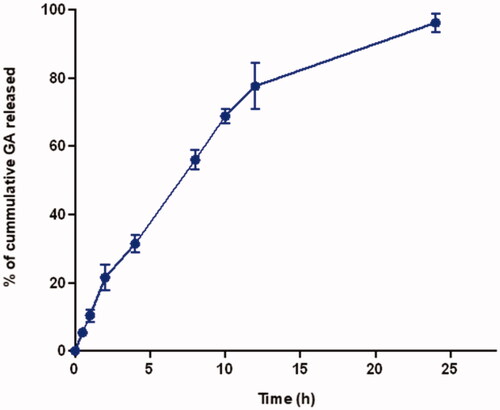
Figure 5. (A) Wound closure in diabetic rats at day 0, 4, 10, and 14 in the five experimental groups. (B) Wound contraction % at day 10. Data are shown as mean (n = 6)±SD. #Significantly varied vs. negative control, αsignificantly varied vs. TA, $significantly varied vs. GA, and *significantly varied vs. positive control.
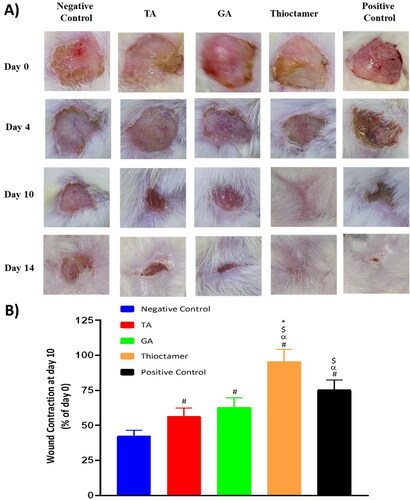
Figure 6. Histopathological effects of thioctamer loaded gel on wound healing on day 10. MT: Masson’s trichrome (scale bar = 50 µm); H&E: hematoxylin and eosin (scale bar = 100 µm).
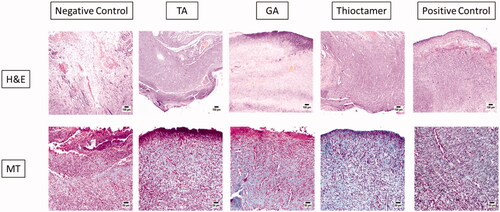
Table 1. Histological estimation of day 10 wound healing after topical application of TA, GA, or thioctamer nanocomplex.
Figure 7. Effect of TA, GA, or thioctamer nanocomplex on TNF-α and IL-6 expression in diabetic rats wounded skin. Data are shown as mean ± SD (n = 6). #Significantly varied vs. negative control, αsignificantly varied vs. TA, $significantly varied vs. GA, and *significantly varied vs. positive control.

Data availability statement
The data presented in this study are available in the article.