Figures & data
Figure 1. Colloidal characterization of SLNs at different pH values. (A) DH and (B) ζ-potential of (red line and circles) PMA, (black line and squares) PCMA, and (blue line and triangles) PCMA-HA. SLNs (10 μL) were diluted in 1 mL of the corresponding buffer (Table SM1), incubated for 30 min, and analyzed by DLS. All measurements were carried out in triplicate at 25 °C. The ζ-potential was calculated according to the Smoluchowski theory. Data appear as the mean value ± standard deviation.
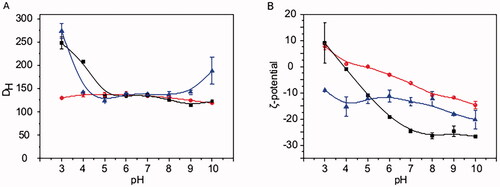
Figure 2. Colloidal characterization of the SLNs before and after the GI digestion process. (A) DH, (B) ζ-potential, and (C) PDI of PMA, PCMA, and PCMA-HA. (Black) Initial state before digestion, (dark grey) oral digesta, (bright grey) gastric digesta and (white) intestinal digesta. Ten microliters of SLNs were diluted in 1 mL of pH 7 buffer (KH2PO4, 1.13 mM), incubated for 30 min, and analyzed by DLS. All measurements were performed in triplicate at 25 °C and the self-optimization routine from the instrument software was used. The ζ-potential was calculated according to the Smoluchowski theory. Data appear as the mean value ± standard deviation. One-way ANOVA statistic test followed by Bonferroni’s multiple comparison post hoc test was applied (p<0.05). Significant differences between digestive samples from the same SLNs are indicated with different letters.
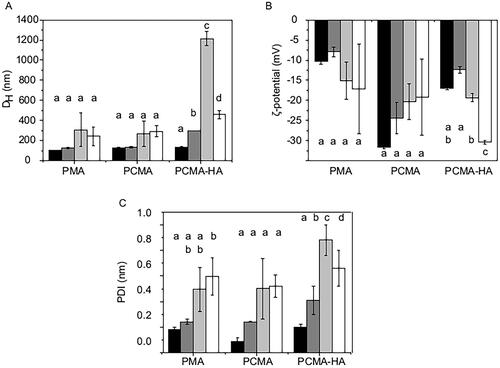
Figure 3. Percentage of MA recovered from (A) the basolateral fraction, (B) cellular fraction, and (C) apical + basolateral + cell fraction samples after 4 h permeability in 21 days old (solid columns) Caco-2 or (striped columns) Caco-2/HT29-MTX (75:25) monolayers treated with PMA GI, PCMA GI and PCMA-HA GI. Final apical volume 0.5 mL and final basolateral volume 1.5 mL. MA was quantified by LC MS/MS. Data are expressed as a % of MA initially added to the apical chamber, and are the average value of at least three independent replicates. Error bars indicate the standard deviation. One-way ANOVA test and Bonferroni’s correction were applied. Significant differences are highlighted with an asterisk ‘*’ (p<0.05).
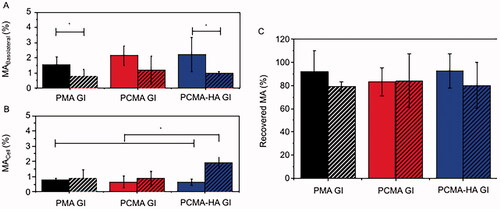
Figure 4. (A, B) Experimental design and confocal fluorescence microscopy images of (C, F, I) control BxPC3 cells, (D, G, J) 21 days old Caco-2 monolayers and (E, H, K) BxPC3 cells in basolateral chamber. (Top image) Red and blue fluorescence merged channel and (bottom image) red fluorescence, blue fluorescence and optic image merged channels. Caco-2 monolayers were treated for 4 h with Nile Red loaded gastrointestinal digested SLNs (PMA GI, PCMA GI and PCMA-HA GI) with pancreatic BxPC3 cells present in the basolateral chamber. Apical chamber consisted of 0.5 mL (final apical volume) DMEM with Nile Red loaded PMA-GI, PCMA-GI or PCMA-HA-GI (0.22 mM of Nile Red final apical concentration). Basolateral chamber consisted of 1.5 mL DMEM with 2.5 × 10⁴ BxPC3 cells/well seeded 24 h earlier. Control experiments were BxPC3 cells incubated directly with 0.5 mL DMEM with Nile Red loaded PMA GI, PCMA GI or PCMA-HA GI (0.22 mM of Nile Red) +1.5 mL of DMEM for 4 h. Excitation and emission wave lengths were 543 nm and 651, and 405 nm and 450 nm, for Nile Red and DAPI respectively.
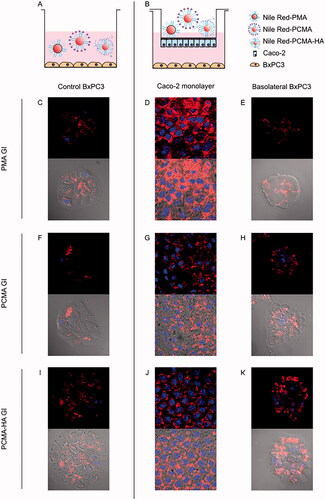
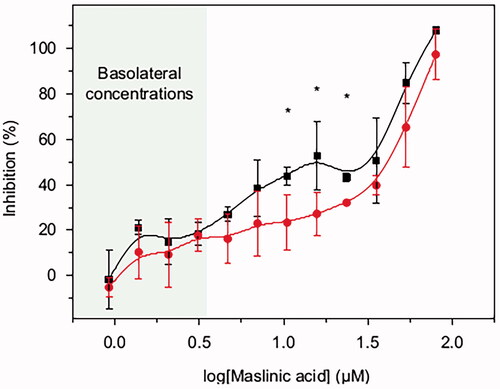
Figure 5. BxPC3 growth inhibition by different concentrations of MA (0.9–79.7 μM) acid over 72 h period. MA was prepared in DMSO and diluted in RPMI. 4.5 × 10⁻³ BxPC3 cells were seeded per well in 96-well plates. After 24 h seeding, the cells were treated with MA test samples. The test samples were refreshed every 12 h (black line and squares) or 24 h (red line and circles). Cell viability at 72 h was measured by MTT. Results are the average value ± standard deviation from three independent assays. Student’s statistic t-test (p<0.05, two tail and two sample t-test for equal variances) was applied for significant differences between the two dosage regimens (12 h or 24 h) for the same MA concentration. Statistically significant differences between regimes (p<0.05) are highlighted with ‘*’.