
Figures & data
Table 1. L9 (34) Orthogonal design table (n = 3).
Figure 1. Design and size distribution of PC-SLN. (A) Schematic design of PC-SLN. (B) Size distribution spectrum as determined by dynamic light scattering.
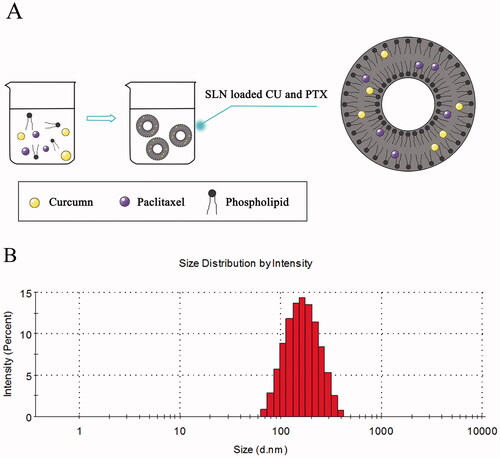
Table 2. Characterization of the prepared SLN (n = 3).
Figure 2. Cytotoxicity of PC-SLN. IC50 values of free PTX and the PTX of (CU + PTX) and PC-SLN on a panel of cell lines were determined at 24 h (A), 48 h (B) and 72 h (C) (means ± SD, n = 3). t test: *, P < .05, there was a significant difference compared with PTX; #, P < .05, there was a significant difference compared with (CU + PTX).
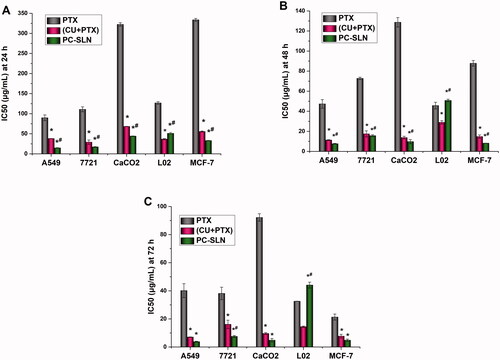
Figure 3. Induction of apoptosis in A549 cells by PC-SLN. Effects of CU (A), PTX (B), (CU + PTX) (C) and PC-SLN (D) at 1 μg/mL, 5 μg/mL and 15 μg/mL with the control on cell death were evidenced by annexin VFITC/PI double staining and FACS analysis. (F) Early apoptosis of CU, PTX, (CU + PTX) and PC-SLN in A549 cells at 48 h. (G) Late apoptosis of CU, PTX, (CU + PTX) and PC-SLN to A549 cells at 48 h. (H) Total apoptosis of CU, PTX, (CU + PTX) and PC-SLN to A549 cells at 48 h (means ± SD, n = 3). t test: *, P < .05, there was a significant difference compared with PTX; #, P < .05, there was a significant difference compared with (CU + PTX).
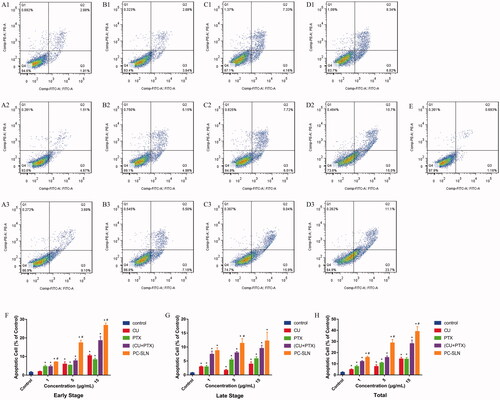
Figure 4. Effects of PC-SLN on cell cycle. Flow cytometry was performed to examine the effects of the cell cycle with CU (A), PTX (B), (CU + PTX) (C) and PC-SLN (D) at 1 μg/mL, 5 μg/mL and 15 μg/mL with the control (E) in A549 cells. Frequency distribution bar chart for G0/G1, S, and G2/M at doses of 1 μg/mL (F), 5 μg/mL (G), and 15 μg/mL (H). (means ± SD, n = 3).
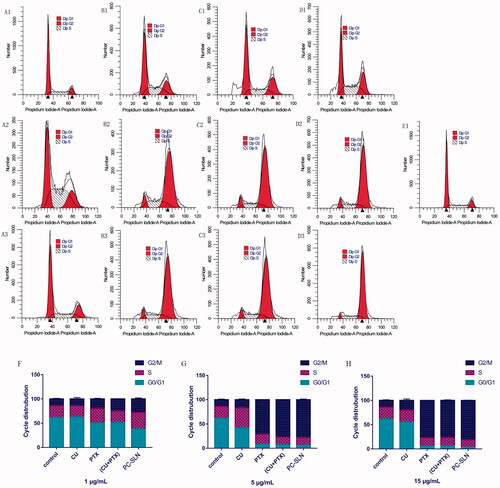
Figure 5. Effects of PC-SLN on biomarkers. (A) Effects of BA, BAD, and BAL on the expression of NF-κB-P65, Bax, Bcl-2 and P-gp by western blotting analysis at three concentrations in A549 cells for 48 h. Effects of CU, PTX, (CU + PTX) and PC-SLN on the value of NF-κB-P65 (B), Bax (C), Bcl-2 (D) and P-gp (E) in A549 cells for 48 h. t test: *, P < .05, compared with negative control group; △, P < .05, compared with the CU group; ▽, P < .05, compared with the PTX group; ∞, P < .05, compared with the CU + PTX group. (means ± SD, n = 3).
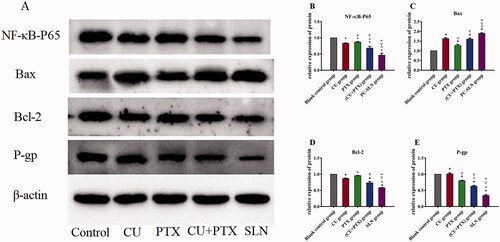
Figure 6. The plasma concentration-time curves of the combination (Group A) and SLNs (Group B) at the same doses. Data from different time points of each group are presented as the mean ± SD (n = 5).
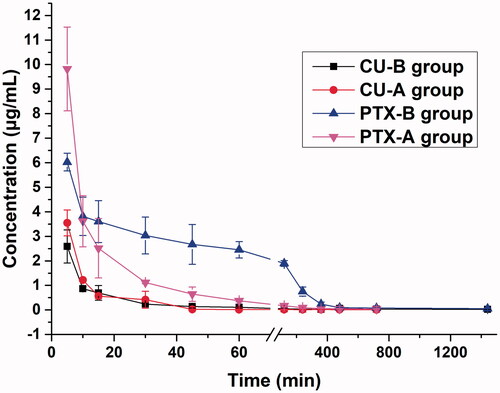
Table 3. Pharmacokinetic parameters of PC-SLN and combination powder in rabbits (n = 5).
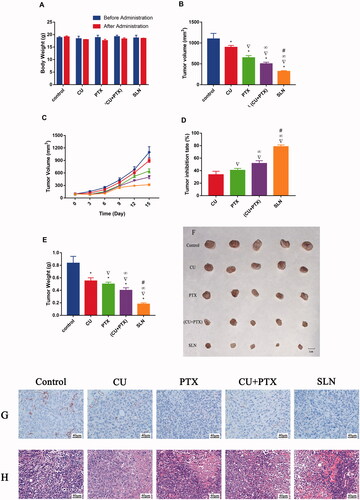
Figure 7. Antitumor efficacy and toxicity of PC-SLN in vivo in nude mice bearing A549 tumor xenografts. (A) Changes in body weight (g) before and after treatment with CU, PTX, (CU + PTX) and PC-SLN in nude mice. (B) Tumor volume of A549-bearing nude mice treated with CU, PTX, (CU + PTX) and PC-SLN on Day 15. (C) Changes in tumor volume in different groups of nude mice. (D) Tumor inhibitory rates (%) of A549-bearing nude mice treated with CU, PTX, (CU + PTX) and PC-SLN on Day 15. (E) Tumor weights (g) of A549-bearing nude mice treated with CU, PTX, (CU + PTX) or PC-SLN on Day 15, after which the mice were humanely sacrificed. (F) Photograph of tumors on Day 15 when the mice were humanely sacrificed. (G) The results of CD31 in tumor tissues were analyzed by immunohistochemistry. (H) The results of tumor mass H&E staining (means ± SD, n = 5). t-test: *, P < .05, compared with the negative control group; ▽, P < .05, compared with the CU group; ∞, P < .05, compared with the PTX group; #, P < .05, compared with the CU + PTX group.
Availability of data and materials
The datasets used or analyzed during the current study are available from the corresponding author on reasonable request.