Figures & data
Figure 1. (A) Synthetic route of mPEG-SS; (B) 1H-NMR spectra of mPEG, mPEG-SH, and mPEG-SS; (C) MS for mPEG-SS; (D) CMC of mPEG-SS with and without H2O2.
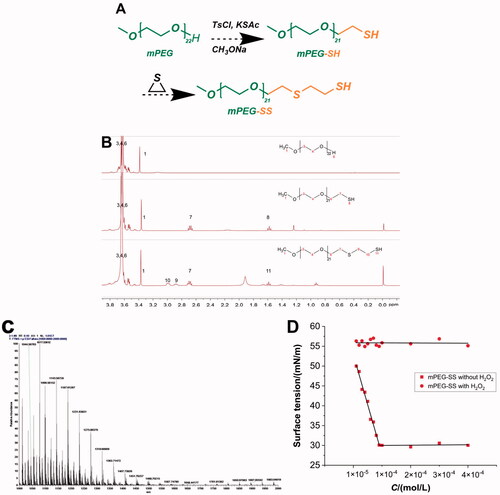
Figure 2. (A) Microstructure of PSC without H2O2 and Tyndall phenomenon (upper right corner) of PSC; (B) Particle size distribution of PSC without H2O2; (C) H2O2 effect on PSC microstructure (24 h); (D) H2O2 effect on PSC particle size; (E) Particle size curve with time; (F) Time-dependent fluorescence of PSF incubated without and with H2O2; (G) Histogram of time-dependent fluorescence; (H) Depolymerization schematic diagram of PSC.
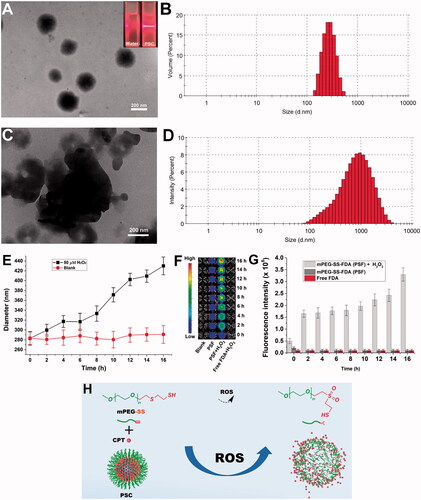
Figure 3. (A) Cytotoxicity of mPEG-SS, CPT, and PSC on HaCaT without H2O2; (B) Cytotoxicity of mPEG-SS, CPT, and PSC on HaCaT under H2O2 condition (*P < 0.05 compared with the control group, n = 3).
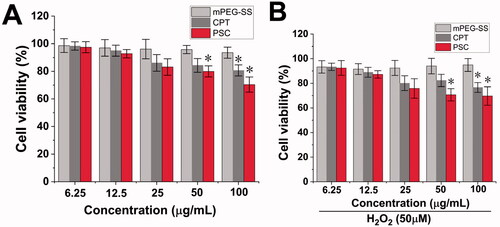
Figure 4. (A) PSC scavenging extracellular ROS; (B) PSC scavenging intracellular ROS; (C) Cellular images of PSC scavenging intracellular ROS of the normal group; (D) H2O2 group; (E) H2O2 + mPEG-ss group; (F) H2O2 + free CPT group; (G) H2O2 + PSD; (H) Positive control group; (scale bar: 20 μm; **P < 0.01; *P < 0.05 compared with the control group, n = 3).
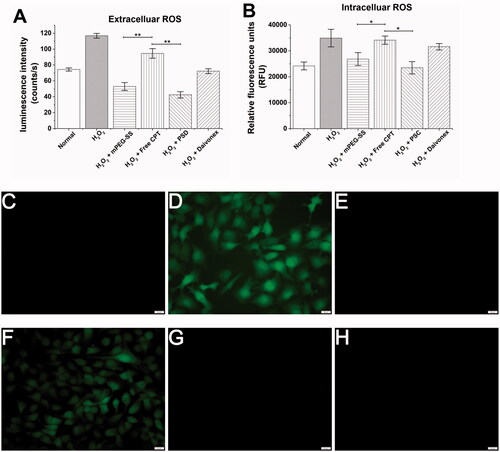
Figure 5. (A) Molding and drugging procedure of psoriasis mice; (B) PASI score (total, erythema, scaling, hypertrophy score); (C) Photographs of dorsal skin of each group of mice; (D) In vivo fluorescence imaging.
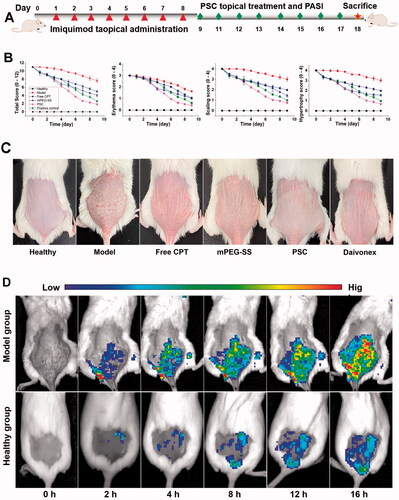
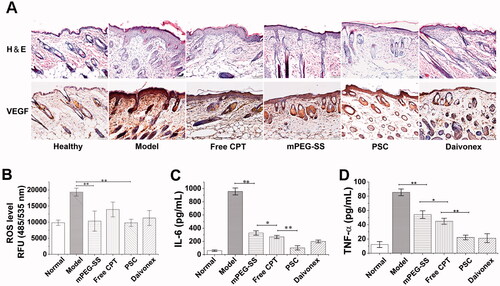
Figure 6. (A) H&E and VEGF staining; (B) In vivo ROS-scavenging effect; (C) Serum IL-6; (D) TNF-α level (**P < 0.01; *P < 0.05 compared with the control group, n = 3).