
Figures & data
Scheme 1. Representation of lipid coated mesoporous silica nanoparticle for co-delivery of carbonic anhydrase IX inhibitor and doxorubicin in hypoxia to overcome chemoresistance.
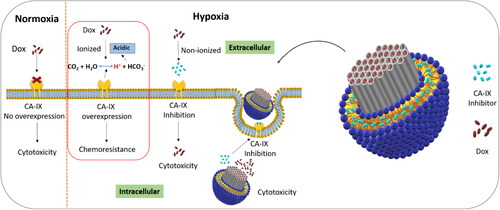
Figure 1. Image representing (a) FTIR spectrums of CTAB, CTAB-MSNPs and MSNPs, (b) MSNPs Nitrogen Adsorption-desorption isotherms before and after washing (c) BJH graph showing the pore size.
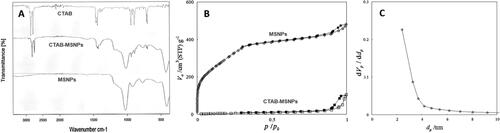
Table 1. Surface area, pore size and volume of MSNPs before and after surfactant removal.
Figure 2. TEM images of (a-b) MSNPs showing the porous structure and (b) (i & ii) are representing FFT and IFFT patterns respectively.
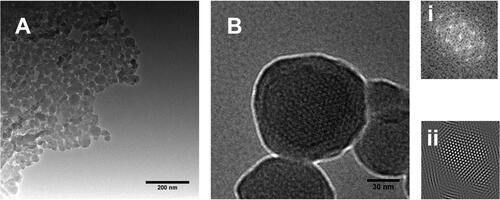
Figure 3. AFM images showing (a & d) amplitude trace, (b & e) height trace, (c & f) respective identified line graph and G as a representative image of surface measurement of lipid coating to MSNPs.
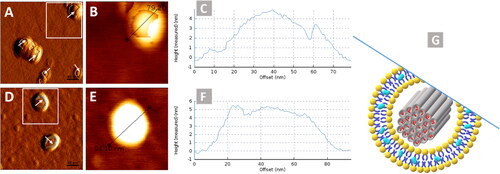
Figure 4. Doxorubicin release profile from Dox-MSNPs and Lipc-Dox-MSNPs.
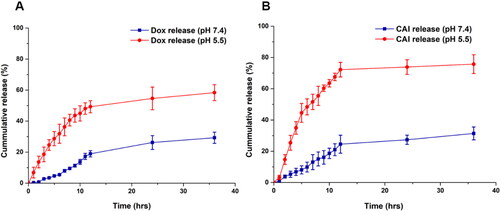
Table 2. Physicochemical parameter changes of formulations after incubating in PBS, medium with 10% and 60% FCS at 37 °C and 100 rpm for 4 h and 24 h. The hydrodynamic size (intensity distribution), PDI and zeta potential are presented as mean ± SD (n = 3).
Figure 5. Showing (a) Western blots of CA-IX and HIF-1α expression under normoxia and hypoxia, (b) CA-IX expression after treatment, (c and d) Extracellular acidification in normoxia and hypoxia before and after traetment with CAI, Lipc and Lipc-Dox-MSNPs after 4 h and 24 h incubation respectively. Values are represented as mean ± SD (n = 3) and statistical significance p values (p < 0.05) are presented as ***p < 0.001, **p < 0.01, *p < 0.1 and nsp = non-significant.
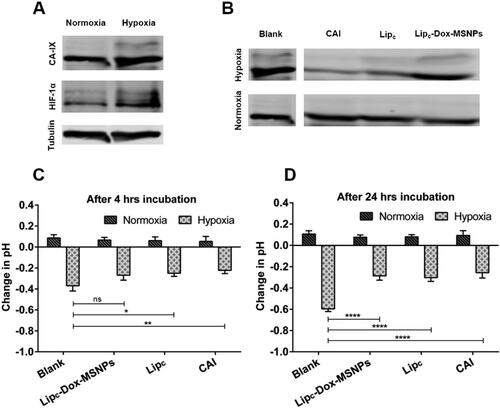
Figure 6. In vitro cytotoxicity evaluation of (a) Dox (4 h & 24 h incubation) with CAI and Lipc pretreated cells in normoxia and hypoxia and (b) Lipc-Dox-MSNPs, Lip-Dox-MSNPs and Dox after 4 h & 24 h incubation in normoxia and hypoxia. Values are represented as mean ± SD (n = 3) and statistical significance p values (p < 0.05) are presented as ***p < 0.001, **p < 0.01, *p < 0.1 and nsp = non-significant.
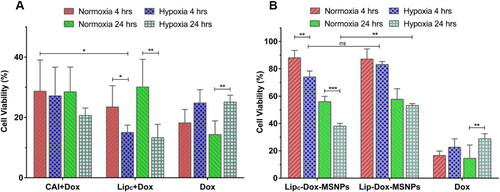
Figure 7. In vitro cellular uptake of doxorubicin where (a) is the representing qualitative uptake of Dox with different formulations in normoxia and hypoxia observed witgh CLSM and (b) Quantitaive evaluation of mean fluorescenc intensity (MFI) of Dox uptake with different formulation measured with FACS. Values are represented as mean ± SD (n = 3) and statistical significance p values (p < 0.05) are presented as ****p < 0.0001.
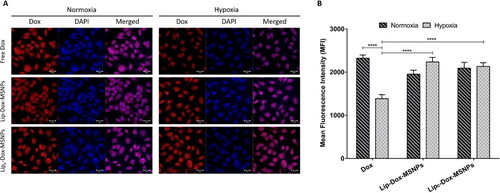
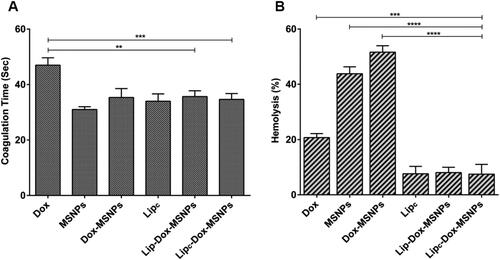
Figure 8. Hemocmpatibility assay showing (a) coagulation time and (b) hemolysis effects of different formulations and free Dox. Tritox-X100 and blood plasma were considered as negative and positive control. All the values are represented as mean of triplicate along with standard deviation. Values are represented as mean ± SD (n = 3) and statistical significance p values (p < 0.05) are presented as ****p < 0.0001, ***p < 0.001, **p < 0.01.
Supplemental Material
Download MS Word (3.3 MB)Data availability statement
The data that support the findings of this study are available from the corresponding author, U.B., upon reasonable request.