
Figures & data
Figure 1. Elaboration scheme of dexamethasone-fibronectin co-loaded PLGA microspheres. Created with BioRender.com.
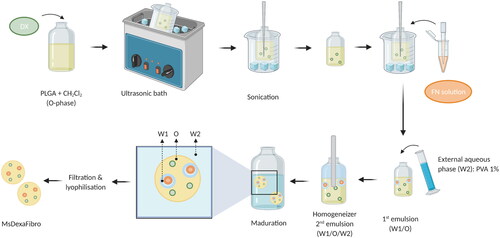
Figure 2. Dexamethasone-fibronectin co-loaded PLGA microspheres morphology. Scanning (left and center) and transmission (right) electron microscopy images.
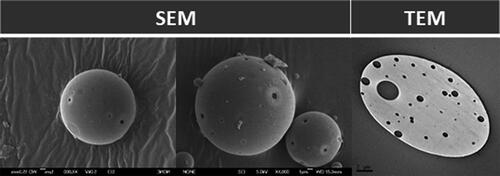
Figure 3. Cumulative in vitro release of fibronectin from dexamethasone-fibronectin co-loaded PLGA microspheres.
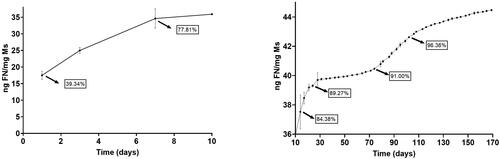
Figure 4. Cumulative in vitro release of dexamethasone from dexamethasone-fibronectin co-loaded PLGA microspheres.
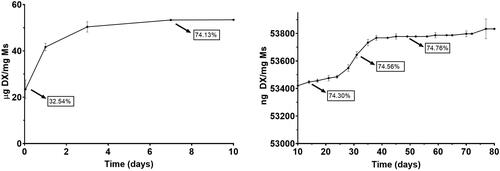
Figure 5. Intraocular pressure in the dexamethasone-fibronectin co-loaded microsphere (MsDexaFibro) model. a: Intraocular pressure curve over 6 months. b: Percentage of ocular hypertensive eyes (>20 mmHg). c: Percentage of corticosteroid response and tendency in right eyes over the study. d: Averaged percentage of corticosteroid response in right eyes. Low: <6 mmHg increase; medium: 6–15 mmHg increase; high: >15 mmHg increase. Abbreviations: IOP: intraocular pressure; RE: right eye; LE: left eye; w: week; OHT: ocular hypertension; %: percentage *: p < 0.05; #: p < 0.02 (Bonferroni Correction for multiple comparisons).
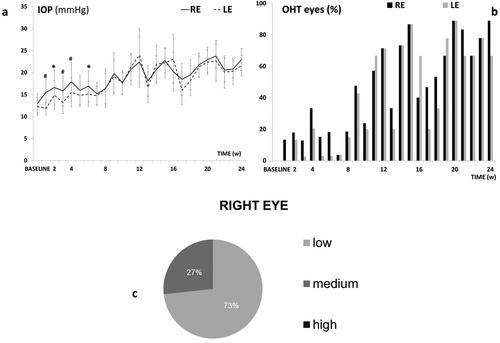
Figure 6. Neuroretina functionality, measured by dark- and light-adapted electroretinography (ERG), in the dexamethasone-fibronectin co-loaded microspheres (MsDexaFibro) model over 6 months of follow-up. MsDexafibro: microspheres loaded with dexamethasone and fibronectin; RE: right eye; LE: left eye; w: week; DA: dark-adapted; LA: light-adapted; μV: microvolts; ms: milliseconds.
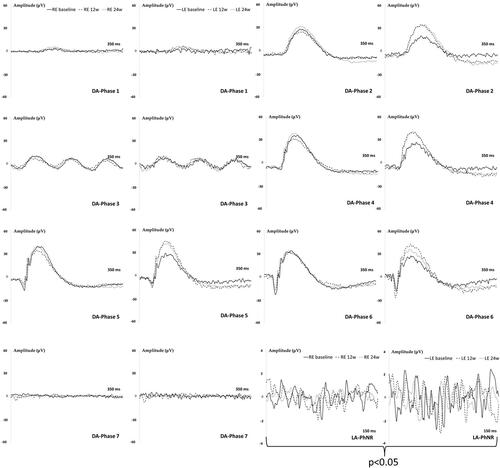
Figure 7. A Neuro-retinal thickness in microns by OCT throughout 6-month follow-up. B. Average thickness percentage loss by OCT in microspheres co-loaded with dexamethasone and fibronectin (MsDexaFibro) model up to 6-month follow-up. MsDexaFibro: microspheres co-loaded with dexamethasone and fibronectin; RE: right eye; LE: left eye; OCT: optical coherence tomography; RNFL: Retinal Nerve Fiber Layer; GCL: Ganglion Cell Layer complex; average thickness in microns (μm); w: week; %: percentage.
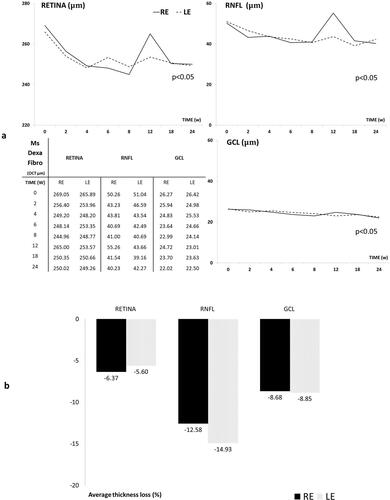
Figure 8. Neuro-retinal loss rate measured by optical coherence tomography (OCT) in the co-loaded with dexamethasone and fibronectin microspheres (MsDexaFibro) model. MsDexaFibro: microspheres co-loaded with dexamethasone and fibronectin; RE: right eye; LE: left eye; w: week; RNFL: Retinal Nerve Fiber Layer; GCL: Ganglion Cell Layer complex.
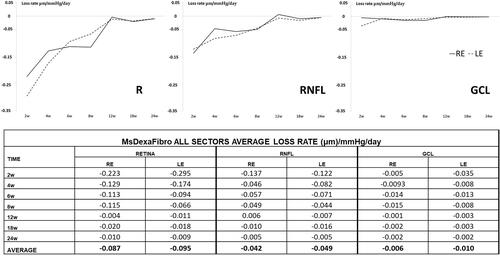
Figure 9. Ganglion cell analysis in glaucomatous eyes. A. Ganglion cells were counted in four areas (squares) of a radial section of the retina passing through the optic nerve. B. Two representative images of the retina marked with anti-Brn3a corresponding to a left non-intervened eye (LE) and a right eye (RE) injected with dexamethasone-fibronectin microspheres from the same animal. The mean number of ganglion cells per linear mm of retina was not different between non-intervened and injected eyes. GCL: Ganglion cell layer; INL: Inner nuclear layer; ONL: Outer nuclear layer. Scale bars: (A) 1 mm, (B) 30 µm.
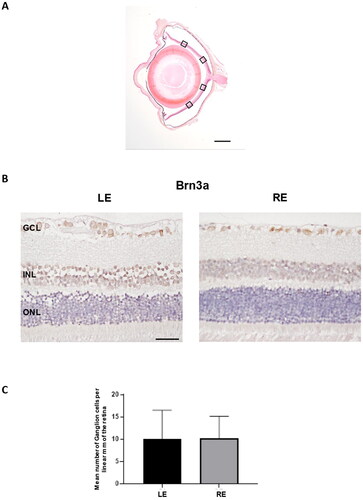
Figure 10. Detection of microspheres in injected eyes. A. Paraffin sections stained with Hematoxylin/Eosin exhibited the presence of the microspheres integrated into the iridocorneal angle (arrowheads), a finding never observed in the control ones. B. The characteristic light diffraction produced by microspheres using Nomarski microscopy (arrowheads) confirmed their presence in the iridocorneal angle of injected eyes. C. The Fluorescent Stain BODIPY (green) also showed the presence of microspheres hampering the iridocorneal angle and the trabecular meshwork. Nuclei were counterstained with Hoechst (blue). LE: left eye (non-intervened); RE: Right eye (dexamethasone-fibronectin microsphere injected). CB: Ciliary body; I: Iris; C: cornea; TM: Transmission mode. Scale bars: 100 µm.
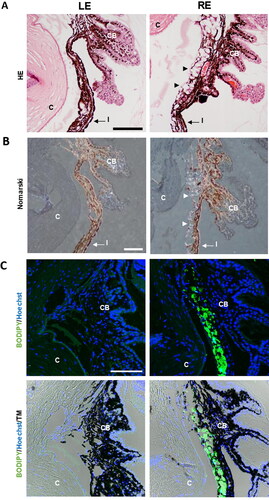
Figure 11. Iridocorneal synechias were observed in injected eyes (arrows). A. General view of a synechia between iris and the cornea. B. Using Nomarski microscopy, the diffracted light from the microspheres (arrowheads) was observed between the cornea and iris at the level of the focal contact between them. C. Staining with BODIPY (green) confirmed the presence of microspheres gluing the cornea and iris. Nuclei were counterstained with Hoechst (blue). C: cornea; I: Iris; L: lens; TM: Transmission mode. Scale bars: 100 µm.
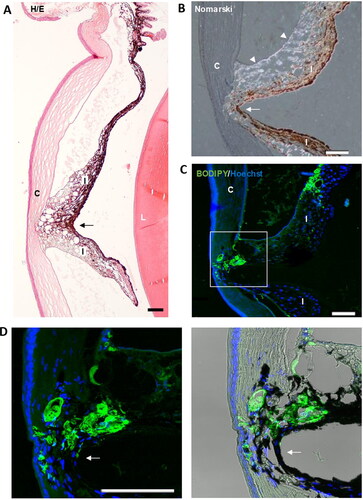
Table 1. Pressure dependent glaucoma rat models.